Today, we are excited to announce the integration of AppDynamics in Azure Spring Cloud for full stack observability.
Over the past 20 months, we worked with many enterprise customers to learn about the scenarios they face. Many of these customers have thousands of Spring Boot applications running in on-premises data centers. As they migrate these applications to the cloud, they need to instrument them for application performance monitoring (APM) using solutions their developers are familiar with and have been using for years. In addition, they must ensure continuity for desktop and mobile applications that are already pre-instrumented for end-to-end monitoring using agents like AppDynamics, which automatically discovers and maps all applications, microservices, and infrastructure as well as any dependencies in dynamic hybrid, multicloud environments. With the integration of AppDynamics in Azure Spring Cloud, you can continue your journey and easily instrument your Spring Boot applications with AppDynamics.
“Our deployment of Azure Spring Cloud is just one component of a much broader multi-region, multicloud architecture. We’ve used AppDynamics at Digital Realty for several years and had a strong desire to have this single pane of glass to capture performance metrics and monitor availability across the full stack. But not only that, AppDynamics is a powerful APM tool that is one component of adopting an event-driven architecture. We are experimenting with self-healing and AIOps and need to expand our capabilities in this area, which we can now do.“—Devon Yost, Enterprise Architect, Digital Realty Trust
As our customers look to modernize their applications and leverage the ease of use and scaling of cloud platforms like Azure Spring Cloud, the need for full stack observability is more important than ever. Many of Presidio’s customers leverage the instrumentation capabilities of AppDynamics to run their Spring Boot applications in the high performing, cost efficient, and highly available manner that their businesses demand. As they plan their migrations to Azure and the Azure Spring Cloud Platform, they will need more than ever consistency of insights and visibility into their applications. Azure Spring Cloud support for AppDynamics brings together the two platforms and gives Presidio and its customers a clear path forward.”—Rich Gondek, Senior Technical Director, Digital Business Solutions and Services, Presidio.
I’m excited by our continued partnership with Microsoft. AppDynamics will provide developers working within Azure Spring Cloud with real-time visibility, with correlated insights that enable them to isolate the root cause of any performance issues and optimize microservices with context to the business impact.”—Gregg Ostrowski, Executive CTO at AppDynamics
Microsoft is committed to making it easier for Spring developers to run their apps at scale on Azure. AppDynamics is a critical part of full stack observability for many of our customers, and through our partnership they can now get this functionality integrated into Azure Spring Cloud. Supporting APM tools of choice for developers—like AppDynamics—minimizes change so they can focus on delivering new capabilities.”—Julia Liuson, Corporate Vice President, Developer Division, Microsoft
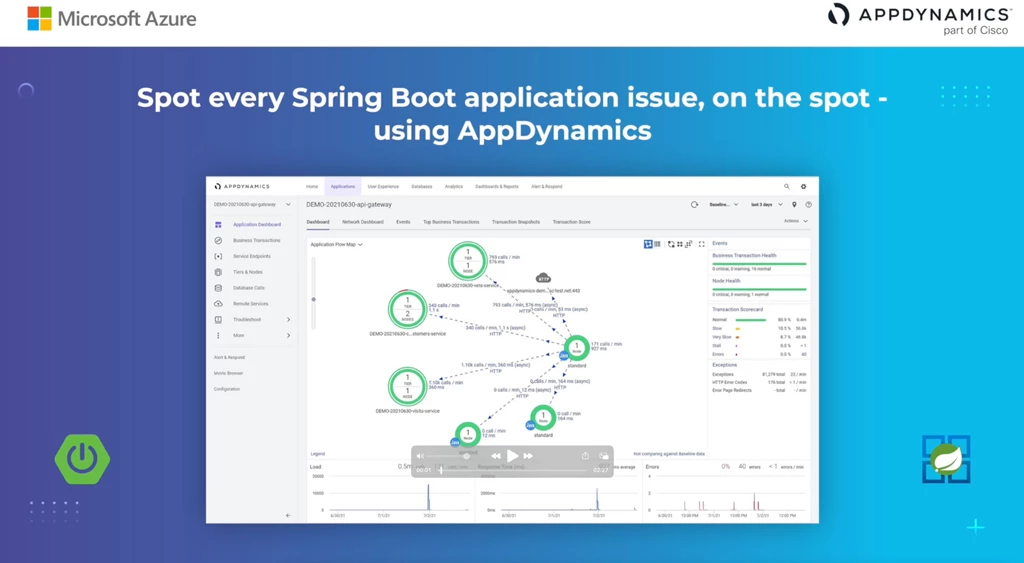
Watch the video above to learn about using AppDynamics to monitor Spring Boot applications.
The ability to observe and correlate applications to the infrastructure, network, and security throughout the entire IT stack is now essential in a digitally transformed world. Technologists demand full-stack observability so they can foresee issues before they affect customers and the business. At the same time, developers continue to innovate and evolve the IT stack by adopting the latest and most agile cloud platforms like Azure Spring Cloud to deploy and run applications at scale quickly and easily. As they do, it is critical that they can move rapidly towards full-stack visibility, insights, and actions transforming siloed data into actionable insights that provide shared context to IT teams so they can deliver exceptional digital experiences, optimize for cost and performance, and maximize digital business revenue.
AppDynamics and Microsoft continue to partner together to ensure that Azure customers can maintain that level of business observability with cloud-native applications on Azure. Now, customers can observe what matters most across their services and workloads deployed on Azure Spring Cloud using AppDynamics—with no code changes required.

Activating the AppDynamics agent in an Azure Spring Cloud deployment is as simple as configuring the JVM options and environment variables when deploying a service via the Azure CLI.
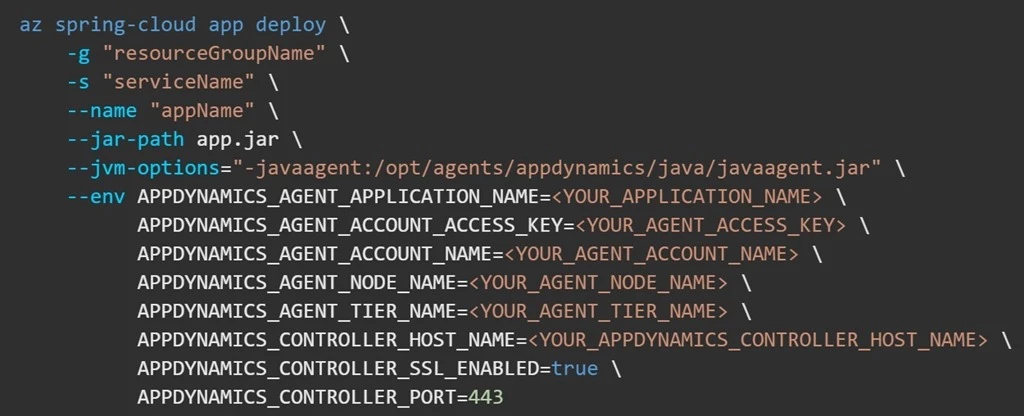
Figure 1: Shows Azure CLI command to activate AppDynamics as part a deployment
The AppDynamics agent can also be activated within Azure Spring Cloud through the Azure Portal, by utilizing Azure Resource Manager (ARM) templates, Bicep templates, or via Terraform.
Upon activation, open the AppDynamics Portal to begin monitoring. In the view shown below, AppDynamics shows all the Spring Boot applications in Azure Spring Cloud.
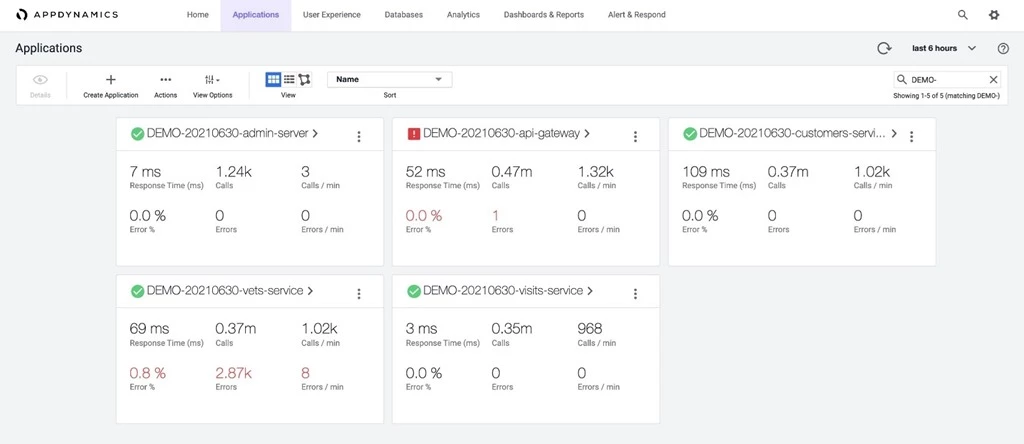
Figure 2: Shows all the Spring Boot applications running in a production workload
You can also see automated flow maps that show the flow of data through your applications, revealing Spring Boot apps and their dependencies and the exact locations of any issues to be addressed to mitigate business impact. In the view shown below, automated flow maps are automatically available to you—no additional configuration required.
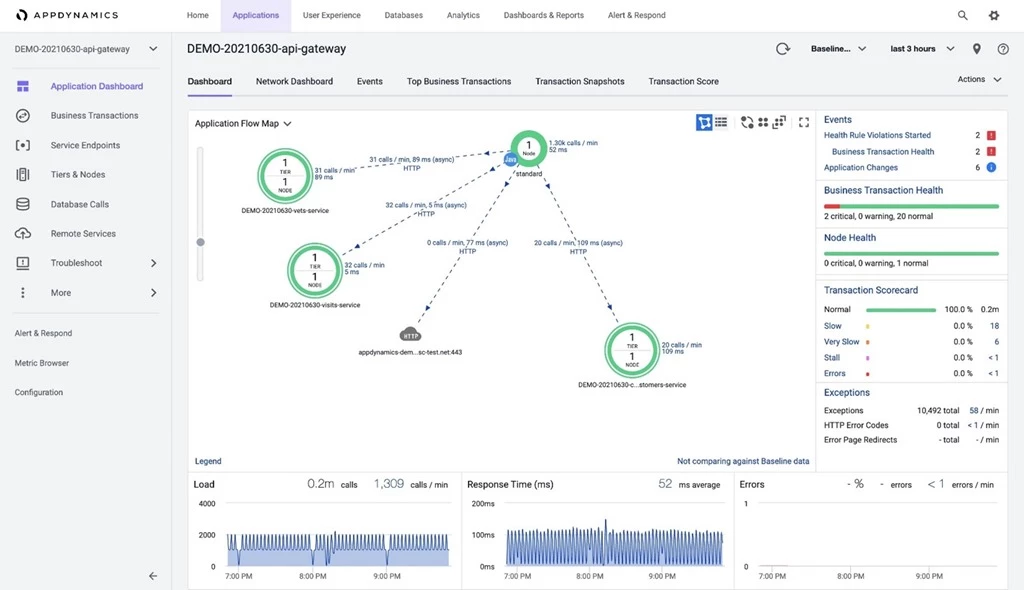
Figure 3: Shows automated app flow maps for Spring Boot applications and their dependencies
AppDynamics traces key business transactions based on production application behavior. It dynamically baselines performance and automatically discovers what is normal, so customers and developers get alerts only when thresholds are exceeded. In the view shown below, it shows the flow of data from api-gateway app to customers-services app, and then to a MySQL database.
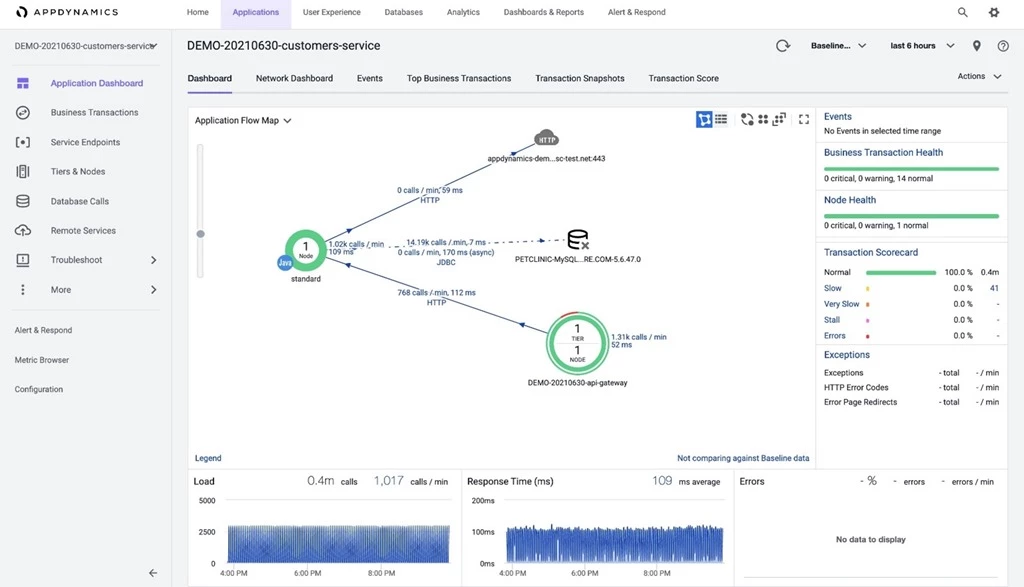
Figure 4: Shows flow of data from one Spring Boot app to another Spring Boot app, and then to a MySQL database
You can also get deep diagnostics such as full call stacks and granular method-level code details and database queries. You can turn on development mode for occasional troubleshooting, in which certain default limits on the data that AppDynamics collects are turned off, giving you additional visibility on application activities. In the view shown below, we are zooming into all the database calls, in the last few hours, there were about 5 million calls with good response times.
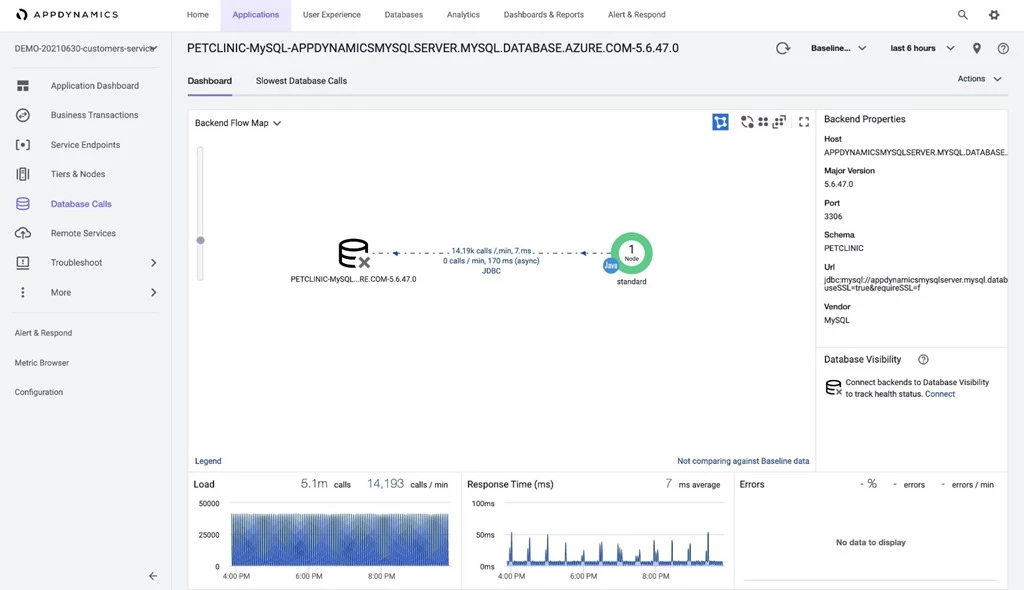
Figure 5: Zooms into all the database calls from a Spring Boot application
You can look for slowest database calls. In the view shown below for customers-service app, these are the slowest database calls—particularly, plenty of time is spent in setting up connections. As always, there is some room for improvement.

Figure 6: Shows slowest database calls from a Spring Boot application
AppDynamics also has a good JVM metric browser where you can look at JVM metrics across time. In the view shown below, you can look at number of JVM threads versus JVM CPU usage. Certainly, you can draw out many more insights through the metric browser.
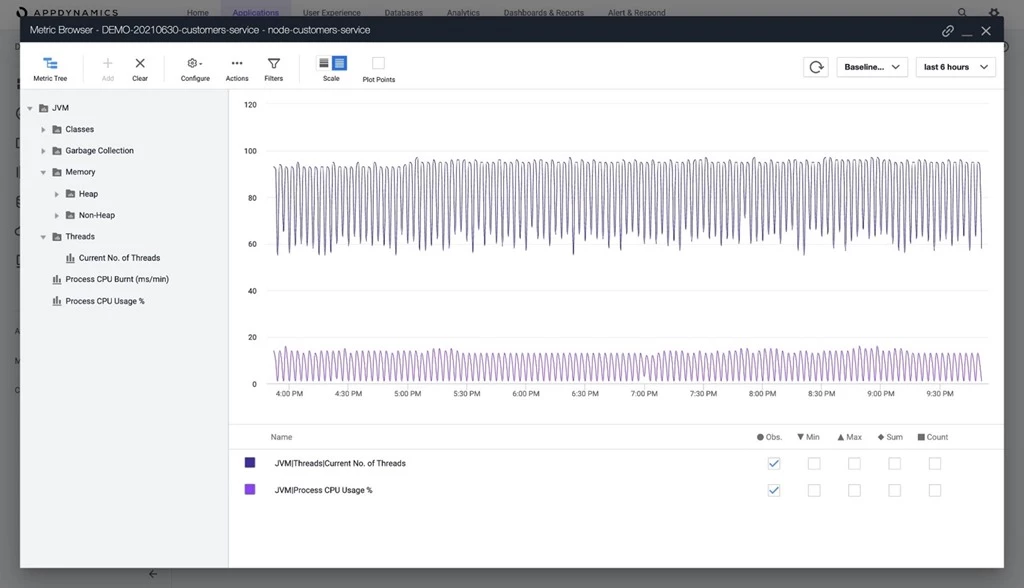
Figure 7: Shows JVM Metrics across time in AppDynamics Metric Browser
By using AppDynamics, you can enable seamless collaboration among developers, operators, and business teams. Unified monitoring and real-time insights bring these teams together to maintain application performance, the user experiences and business performance.
Build your solutions and monitor them today
Azure Spring Cloud is jointly built, operated, and supported by Microsoft and VMware. It is a fully managed service for Spring Boot applications that abstracts away the complexity of infrastructure and Spring Cloud middleware management, so you can focus on building your business logic and let Azure take care of dynamic scaling, patches, security, compliance, and high availability. With a few steps, you can provision Azure Spring Cloud, create applications, deploy and scale Spring Boot applications, and start monitoring in minutes. We will continue to bring more developer-friendly and enterprise-ready features to Azure Spring Cloud. We would love to hear how you are building impactful solutions using Azure Spring Cloud.
Start monitoring your Spring Boot applications with AppDynamics! Learn more about this announcement from AppDynamics.
Resources
- Learn using an MS Learn module or self-paced workshop on GitHub
- Learn more about implementing solutions on Azure Spring Cloud
- See related document published by AppDynamics
- Deploy a distributed version of Spring Petclinic application
- Deploy Spring Boot applications by leveraging enterprise best practices—Azure Spring Cloud Reference Architecture
- Migrate your Spring Boot, Spring Cloud, and Tomcat applications to Azure Spring Cloud
- Wire Spring applications to interact with Azure services
- For feedback and questions, please e-mail us.
