Query Store is a new feature in SQL Server 2016, and now available in preview on the latest version of Azure SQL Database V12. It’s designed to help you with query performance troubleshooting.
As your database grows in size it is not unusual to experience performance regressions. Without the ability to see all the changes in the query plans it’s difficult to figure out why regressions happen and what you can do to prevent them in the future. Troubleshooting can take hours or even days away from your precious productivity time.
Similar to an airplane’s flight data recorder, Query Store collects and presents detailed historic information about all queries, greatly simplifying performance forensics by reducing the time to diagnose and resolve issues.
Collected data is separated by time windows, allowing you to observe changes in query performance over time. If a query generates different plans, you can use Query Store to analyze the plan changes, identify possible performance degradation, and even force the query processor to use a particular plan for your query.
Query Store is accessible through Transact-SQL. To analyze collected data and manage the feature you must install SQL Server Management Studio or SQL Server Data Tools.
We strongly recommend that you to use SQL Server 2016 Management Studio Community Technology Preview 2 , because it comes with a new user interface especially designed for Query Store.
Let’s take a look on how to get started using Query Store for query performance analysis!
Step 1: Enable Query Store for your database
Query Store is a database scoped feature so you must first enable it for the databases that you want to monitor. Once enabled, Query Store will store collected data inside the database storage space. To enable the feature for SQL Database, connect to your Azure SQL Server instance and run the following script while you are connected to the master database:
ALTER DATABASE SET QUERY_STORE = ON;
Alternatively, if you run SSMS 2016 CTP2, you can enable the feature from the user interface. Just right click the target database and click the Properties/Query Store tab:
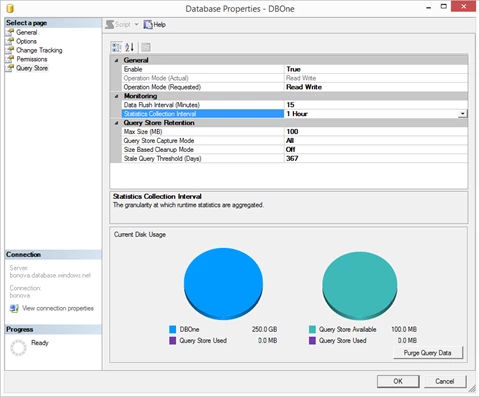
You may want to change defaults for the following options in order to adjust them to your requirements:
- Max Size MB – limit for the data space that Query Store will take inside your database. The default (100 MB) may not be sufficient if your workload generates large number of different queries or plans or if you want to keep query history for a longer period of time. Keep track of current space usage and increase configuration value to prevent Query Store from switching to “Read Only” mode when disk size exceeds the limit.
- Statistics Collection Interval: defines level of granularity for the runtime data (the default is 1 hour). Consider using lower value if you need finer granularity but keep in mind that it will directly affect the size of Query Store data.
For more details on other options please refer to the MSDN documentation for Query Store.
Step 2: Run the workload and perform data analysis
In this step, we will show you how to use Query Store to easily identify the most resource consuming queries in your workload.
If you run SSMS 2016 CTP2, double click on Top Resource Consuming Queries, located in the Query Store sub-folder under the database node in Object Explorer. That will open a new window with detailed information on the most expensive queries in your system:
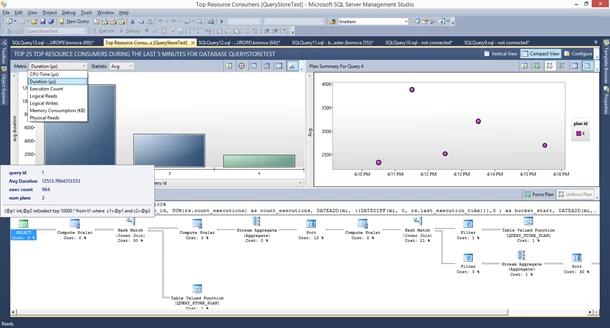
User interface is separated into three panes: A histogram representing top resource consuming queries (left), a plan summary for selected query (right) and visual query plan for selected plan (bottom). Click the Configure button to control how many queries you want to analyze and the time interval of interest. Additionally, you can choose between different resource consumption dimensions (duration, CPU, memory, IO, number of execution) and the baseline (Average, Min, Max, Total, Standard Deviation).
A tooltip over the query provides details on query text, query id (internal identification), average duration, execution count and the number of different plans. Look at the plan summary on the right to analyze the execution history and learn about the different plans and their runtime statistics. Use the bottom pane to examine the different plan shapes or to compare them visually, rendered side by side (use the Compare button).
| View | Description |
| sys.query_store_query_text | Information about captured query texts. |
| sys.query_context_settings | Different runtime combinations of semantics-affecting context settings (SET options that influence plan shape, language ID, …) |
| sys.query_store_query | Unique combination of query text and context settings |
| sys.query_store_plan | Information about plans SQL Server uses to execute queries in the system. |
| sys.query_store_runtime_stats_interval | Aggregation intervals (time windows) created in Query Store. |
| sys.query_store_runtime_stats | Runtime statistics for executed query plans, aggregated on per-interval basis |
Run the following script to get 25 queries based on total duration within last hour of execution:
WITH AggregatedDurationLastHour
AS
(
   SELECT q.query_id, SUM(count_executions * avg_duration) AS total_duration,
   COUNT (distinct p.plan_id) AS number_of_plans
   FROM sys.query_store_query_text AS qt JOIN sys.query_store_query AS q
   ON qt.query_text_id = q.query_text_id
   JOIN sys.query_store_plan AS p ON q.query_id = p.query_id
   JOIN sys.query_store_runtime_stats AS rs ON rs.plan_id = p.plan_id
   JOIN sys.query_store_runtime_stats_interval AS rsi
   ON rsi.runtime_stats_interval_id = rs.runtime_stats_interval_id
   WHERE rsi.start_time >= DATEADD(hour, -1, GETUTCDATE())
   AND rs.execution_type_desc = 'Regular'
   GROUP BY q.query_id
)
,OrderedDuration
AS
(
   SELECT query_id, total_duration, number_of_plans,
   ROW_NUMBER () OVER (ORDER BY total_duration DESC, query_id) AS RN
   FROM AggregatedDurationLastHour
)
SELECT qt.query_sql_text, object_name(q.object_id) AS containing_object,
total_duration AS total_duration_microseconds, number_of_plans,
CONVERT(xml, p.query_plan) AS query_plan_xml, p.is_forced_plan, p.last_compile_start_time,q.last_execution_time
FROM OrderedDuration od JOIN sys.query_store_query AS q ON q.query_id  = od.query_id
JOIN sys.query_store_query_text qt ON q.query_text_id = qt.query_text_id
JOIN sys.query_store_plan p ON q.query_id = p.query_id
WHERE OD.RN <=25 ORDER BY total_duration DESC
The query returns data set as shown on the picture below. Use this result directly or as an input for further analysis based on Transact-SQL scripts. Query Store on MSDN provides more examples.

Step 3: Fix performance for regressed queries
If your workload contains a query that is being executed with different plans and variable performance, you can use Query Store to force SQL Server to always use the optimal plan in future executions. The picture below shows how execution history might look like for one of those queries (query_id and plan_id are permanent internal identifiers assigned by the Query Store to all collected queries and plans) :

The plan Summary pane for Query 1 clearly shows that the query had two plans and the execution with plan id = 1 was much better in terms of duration. Click the Force Plan button when plan id = 1 is selected to make sure that SQL Server always uses that plan. Forced plan now appears with a check mark and Plan Summary shows that it’s being used in subsequent executions:

Plan forcing from Transact-SQL
If you run SQL Server Management Studio prior to 2016 CTP2 you can identify queries with plan regressions by directly querying Query Store views. The script from above is slightly modified to return queries with multiple plans and to include average duration per plan for every measurement interval for the purpose of comparison:
WITH AggregatedDurationLastHour
AS
(
   SELECT q.query_id, SUM(count_executions * avg_duration) AS total_duration,
   COUNT (distinct p.plan_id) AS number_of_plans
   FROM sys.query_store_query_text AS qt JOIN sys.query_store_query AS q
   ON qt.query_text_id = q.query_text_id
   JOIN sys.query_store_plan AS p ON q.query_id = p.query_id
   JOIN sys.query_store_runtime_stats AS rs ON rs.plan_id = p.plan_id
   JOIN sys.query_store_runtime_stats_interval AS rsi
   ON rsi.runtime_stats_interval_id = rs.runtime_stats_interval_id
   WHERE rsi.start_time >= DATEADD(hour, -1, GETUTCDATE())
   AND rs.execution_type_desc = 'Regular'
   GROUP BY q.query_id
)
,OrderedDuration
AS
(
   SELECT query_id, total_duration, number_of_plans,
   ROW_NUMBER () OVER (ORDER BY total_duration DESC, query_id) AS RN
   FROM AggregatedDurationLastHour
)
SELECT qt.query_sql_text, object_name(q.object_id) AS containing_object, q.query_id,
p.plan_id,rsi.start_time as interval_start, rs.avg_duration,
CONVERT(xml, p.query_plan) AS query_plan_xml
FROM OrderedDuration od JOIN sys.query_store_query AS q ON q.query_id  = od.query_id
JOIN sys.query_store_query_text AS qt ON q.query_text_id = qt.query_text_id
JOIN sys.query_store_plan AS p ON q.query_id = p.query_id
JOIN sys.query_store_runtime_stats AS rs ON rs.plan_id = p.plan_id
JOIN sys.query_store_runtime_stats_interval AS rsi ON rsi.runtime_stats_interval_id = rs.runtime_stats_interval_id
WHERE rsi.start_time >= DATEADD(hour, -1, GETUTCDATE())
AND OD.RN <=25 AND number_of_plans > 1
ORDER BY total_duration DESC, query_id, rsi.runtime_stats_interval_id, p.plan_id
This is the part of the obtained data set:

From the data set you can observe that query id = 1 was executed with two plans that had different performance (additionally, you can click on query_plan_xml column in the result grid to visually inspect the difference). The plan with plan id = 1 (green rectangles) shows on average 2-3 better performance (i.e. less avg_duration), than plan id =2 (red rectangles) for every measurement interval.
Therefore, you will likely want to enforce plan id = 1 for query id = 1:
EXEC sys.sp_query_store_force_plan @query_id = 1, @plan_id = 1;
Next steps
For more detailed information about Query Store, check out our online preview documentation and Channel 9 discussion.
Please post your questions and comments below – we’re eager to hear your feedback to help improve the feature going forward.