Azure Monitor’s new source map support expands a growing list of tools that empower developers to observe, diagnose, and debug their JavaScript applications.
Difficult to debug
As organizations rapidly adopt modern JavaScript frontend frameworks such as React, Angular, and Vue, they are left with an observability challenge. Developers frequently minify/uglify/bundle their JavaScript application upon deployment to make their pages more performant and lightweight which obfuscates the telemetry collected from uncaught errors and makes those errors difficult to discern.
Source maps help solve this challenge. However, it’s difficult to associate the captured stack trace with the correct source map. Add in the need to support multiple versions of a page, A/B testing, and safe-deploy flighting, and it’s nearly impossible to quickly troubleshoot and fix production errors.
Unminify with one-click
Azure Monitor’s new source map integration enables users to link an Azure Monitor Application Insights Resource to an Azure Blob Services Container and unminify their call stacks from the Azure Portal with a single click. Configure continuous integration and continuous delivery (CI/CD) pipelines to automatically upload your source maps to Blob storage for a seamless end-to-end experience.
Microsoft Cloud App Security’s story
The Microsoft Cloud App Security (MCAS) Team at Microsoft manages a highly scalable service with a React JavaScript frontend and uses Azure Monitor Application Insights for clientside observability.
Over the last five years, they’ve grown in their agility to deploying multiple versions per day. Each deployment results in hundreds of source map files, which are automatically uploaded to Azure Blob container folders according to version and type and stored for 30 days.
Daniel Goltz, Senior Software Engineering Manager, on the MCAS Team explains, “The Source Map Integration is a game-changer for our team. Before it was very hard and sometimes impossible to debug and resolve JavaScript based on the unminified stack trace of exceptions. Now with the integration enabled, we are able to track errors to the exact line that faulted and fix the bug within minutes.”
Debugging JavaScript demo
Here’s an example scenario from a demo application:
Get started
Configure source map support once, and all users of the Application Insights Resource benefit. Here are three steps to get started:
- Enable web monitoring using our JavaScript SDK.
- Configure a Source Map storage account.
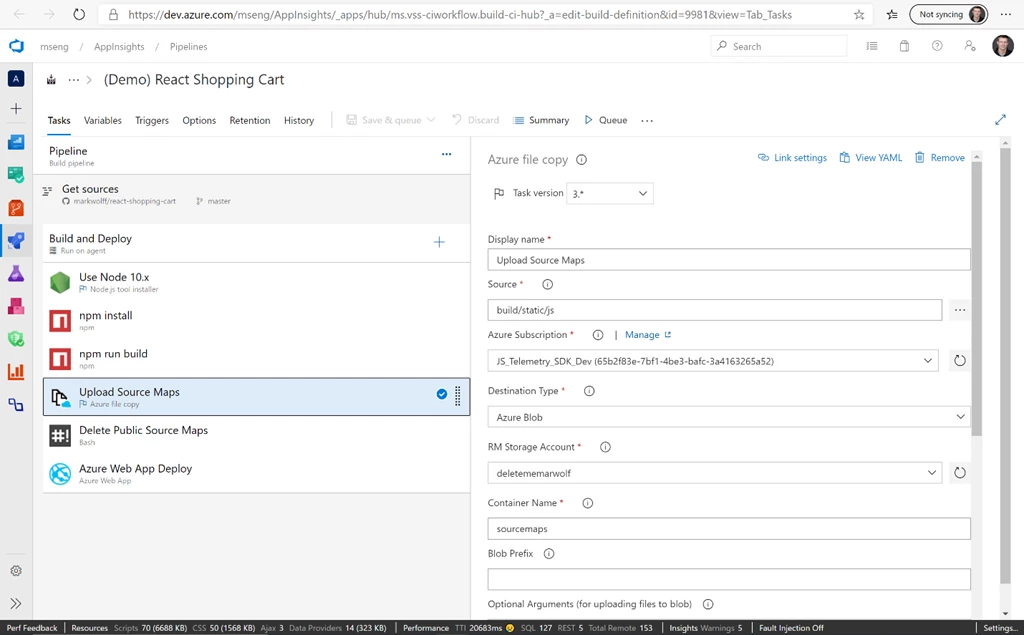
- Configure CI/CD pipeline.
Note: Add an Azure File Copy task to your Azure DevOps Build pipeline to upload source map files to Blob each time a new version of your application deploys to ensure relevant source map files are available.
Manually drag source map
If source map storage is not yet configured or if your source map file is missing from the configured Azure Blob storage container, it’s still possible to manually drag and drop a source map file onto the call stack in the Azure Portal.
Submit your feedback
Finally, this feature is only possible because our Azure Monitor community spoke out on GitHub. Please keep talking, and we’ll keep listening. Join the conversation by entering an idea on UserVoice, creating a new issue on GitHub, asking a question on StackOverflow, or posting a comment below.