你当前正在访问 Microsoft Azure Global Edition 技术文档网站。 如果需要访问由世纪互联运营的 Microsoft Azure 中国技术文档网站,请访问 https://docs.azure.cn。
配置 Grafana 以可视化托管实例群集发出的指标
部署 Azure Managed Instance for Apache Cassandra 群集时,该服务会在每个数据节点上预配适用于 Apache Cassandra 的指标收集器代理软件。 这些指标可由 Prometheus 使用,并通过 Grafana 进行可视化。 本文介绍如何配置 Prometheus 和 Grafana 以可视化托管实例群集发出的指标。
需要完成以下任务才能可视化指标:
- 在托管实例所在的 Azure 虚拟网络中部署一个 Ubuntu 虚拟机。
- 在 VM 中安装 Prometheus 仪表板。
警告
Prometheus 和 Grafana 是开源软件,不支持作为 Apache Cassandra 服务的 Azure 托管实例的一部分。 按照下面所述的方式可视化指标需要将虚拟机作为 Prometheus 和 Grafana 的服务器进行托管和维护。 以下说明仅针对 Ubuntu Server 18.04 进行了测试,不能保证它们将与其他 Linux 分发版配合使用。 遵循此方法需要支持可能出现的任何问题,例如空间不足或服务器的可用性。 若要获得完全支持的和托管的指标体验,请考虑使用 Azure Monitor 指标,或者考虑使用 Azure Monitor 合作伙伴集成。
部署 Ubuntu 服务器
登录 Azure 门户。
导航到托管实例群集所在的资源组。 选择“添加”并搜索“Ubuntu Server 18.04 LTS”映像:
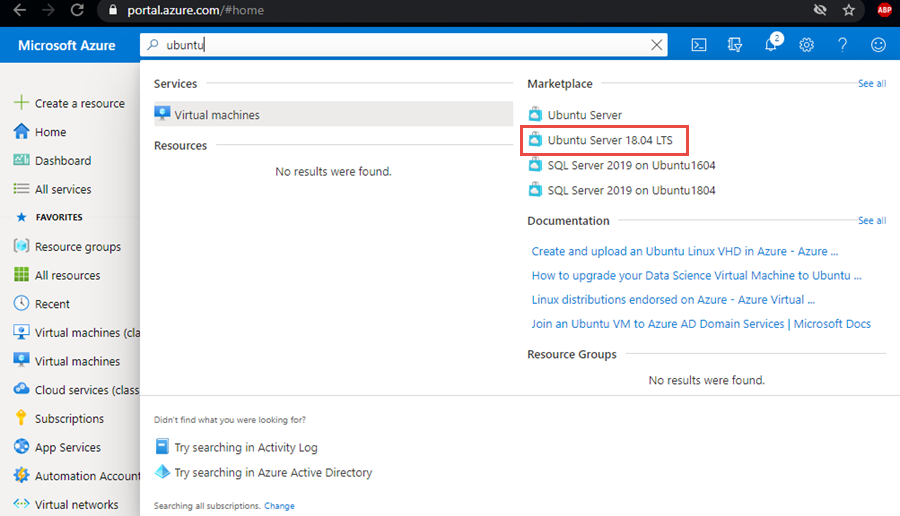
选择该映像,然后选择“创建”。
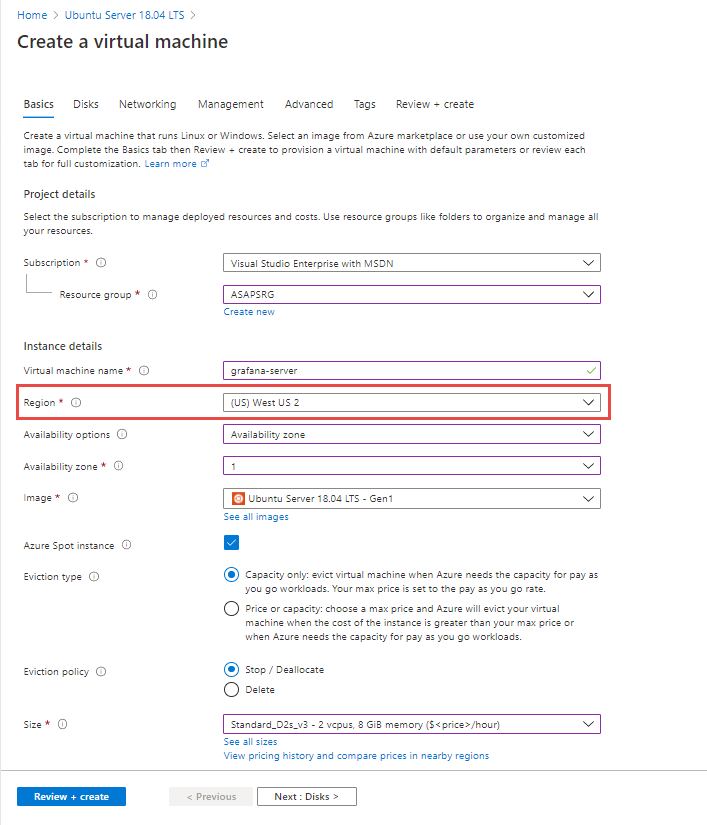
在“创建虚拟机”边栏选项卡中输入以下字段的值,可为其他字段保留默认值:
- 虚拟机名称 - 输入 VM 的名称。
- 区域 - 选择部署了你的虚拟网络的同一区域。
在“网络”选项卡中,选择托管实例所部署到的虚拟网络:
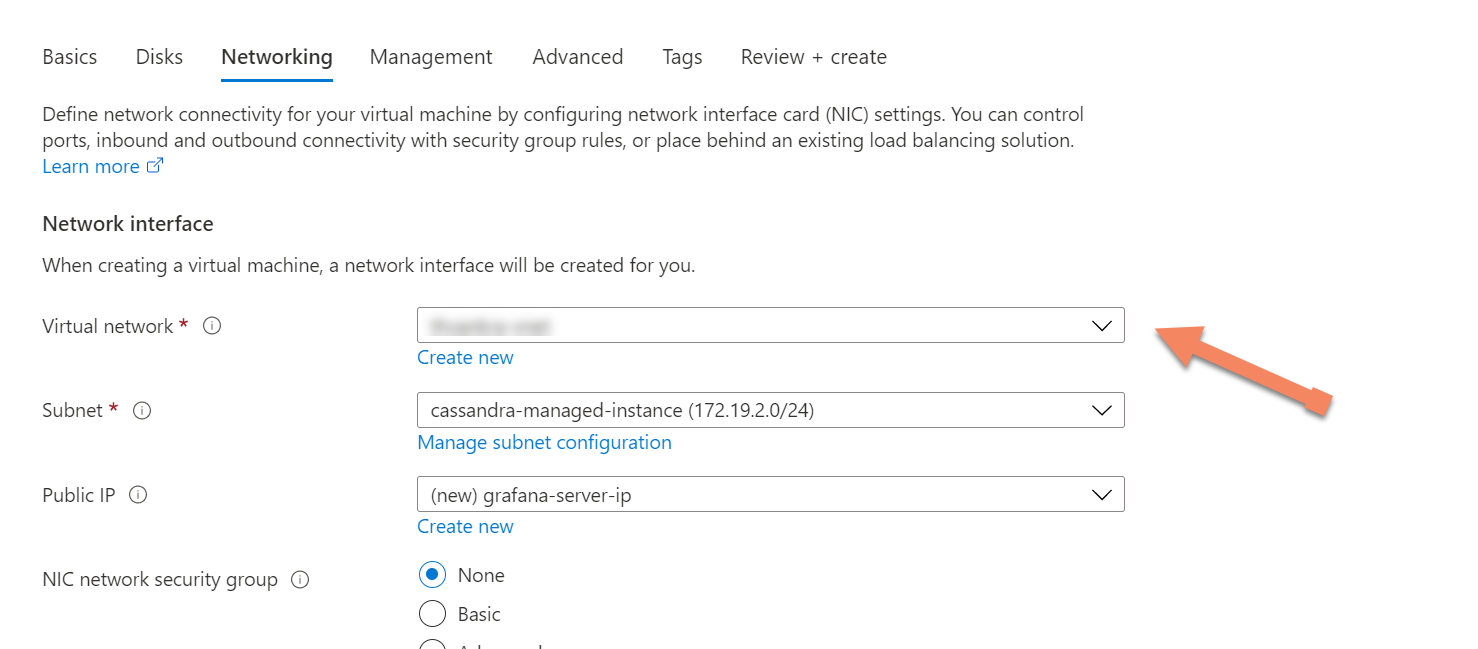
最后,选择“查看 + 创建”以创建指标服务器。
安装 Prometheus 仪表板
首先,确保新部署的 Ubuntu 服务器的网络设置具有允许端口
9090和3000的入站端口规则。 稍后,Prometheus 和 Grafana 分别需要它们。
使用 Azure CLI 或你偏好的客户端工具通过 SSH 连接到 Ubuntu Server。
连接到 VM 后,必须安装指标收集器软件。 首先,下载文件并将其解压缩:
 #install unzip utility (if not already installed)
 sudo apt install unzip

 #get dashboards
 wget https://github.com/datastax/metric-collector-for-apache-cassandra/releases/download/v0.3.0/datastax-mcac-dashboards-0.3.0.zip -O temp.zip
 unzip temp.zip
接下来,导航到 prometheus 目录,并使用 vi 编辑
tg_mcac.json文件:cd */prometheus vi tg_mcac.json在
targets中添加群集中每个节点的 IP 地址,端口均为 9443。tg_mcac.json文件应如下所示:[ { "targets": [ "10.9.0.6:9443","10.9.0.7:9443","10.9.0.8:9443" ], "labels": { } } ]保存文件。 接下来,在同一目录中编辑
prometheus.yaml文件。 找到下列部分:file_sd_configs: - files: - 'tg_mcac.json'在本部分的正下方,添加以下内容。 这是必需的,因为指标通过 https 公开。
scheme: https tls_config: insecure_skip_verify: true该文件现应如下所示。 确保每行上的选项卡如下所示。
file_sd_configs: - files: - 'tg_mcac.json' scheme: https tls_config: insecure_skip_verify: true保存文件。 现在可以启动 Prometheus 和 Grafana 了。 首先,安装 Docker:
sudo apt install apt-transport-https ca-certificates curl software-properties-common
curl -fsSL https://download.docker.com/linux/ubuntu/gpg | sudo apt-key add -
sudo add-apt-repository "deb [arch=amd64] https://download.docker.com/linux/ubuntu `lsb_release -cs` test"
sudo apt update
sudo apt install docker-ce
然后安装 Docker Compose:
sudo apt install docker-compose接下来,导航到
docker-compose.yaml所在的顶级目录,然后启动应用程序:cd .. sudo docker-compose upPrometheus 应该可以在端口
9090使用,Grafana 仪表板则可以在指标服务器上的端口3000使用:
后续步骤
在本文中,你已了解如何使用 Grafana 配置仪表板以可视化 Prometheus 中的指标。 请参阅以下文章详细了解 Azure Managed Instance for Apache Cassandra: