你当前正在访问 Microsoft Azure Global Edition 技术文档网站。 如果需要访问由世纪互联运营的 Microsoft Azure 中国技术文档网站,请访问 https://docs.azure.cn。
使用 Azure Monitor 监视 Azure Managed Instance for Apache Cassandra
Azure Managed Instance for Apache Cassandra 通过 Azure Monitor 提供指标和诊断日志记录。
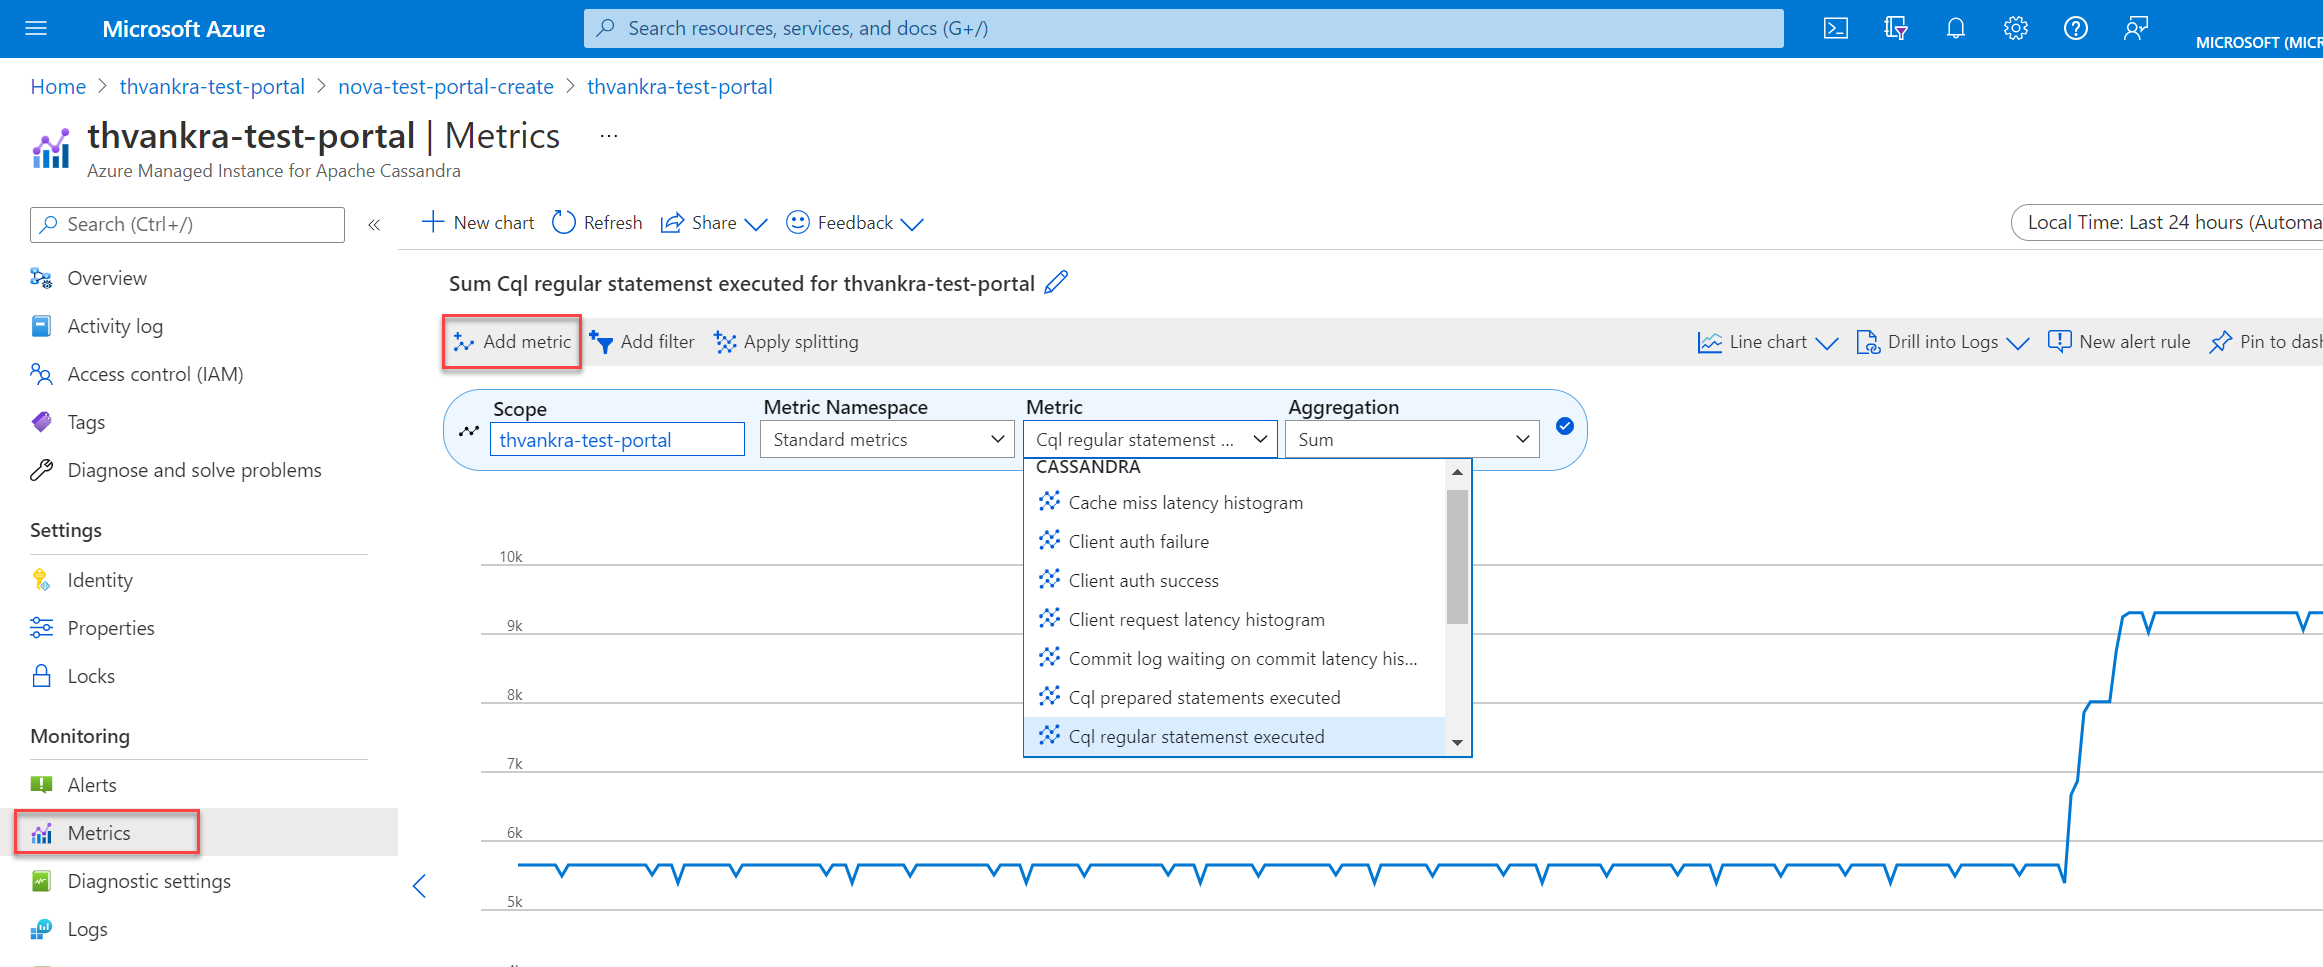
Azure Managed Instance for Apache Cassandra 指标
可以在 Azure 门户中转到群集资源并选择“指标”,来可视化 Azure Managed Instance for Apache Cassandra 的指标。 然后,可以从可用的指标和聚合中进行选择。
Azure 中的诊断设置
Azure Monitor 使用诊断设置来收集资源日志,这些日志也称为数据平面日志。 Azure 资源发出资源日志以提供有关其操作的丰富频繁数据。 Azure Monitor 根据请求捕获这些日志。 数据平面操作的示例包括 delete、insert 和 readFeed。 这些日志的内容因资源类型而异。
平台指标和活动日志是自动收集的;必须创建一个诊断设置才能收集资源日志,或在 Azure Monitor 外部转发这些日志。 可为 Azure Managed Instance for Apache Cassandra 群集资源启用诊断设置,并将资源日志发送以下源:
- Log Analytics 工作区。 发送到 Log Analytics 工作区的数据将写入到 Azure 诊断(旧版)或特定于资源的(预览版)表中。
- 事件中心。
- “存储帐户”。
注意
建议在特定于资源的模式下创建诊断设置。
通过 Azure 门户创建诊断设置
登录 Azure 门户。
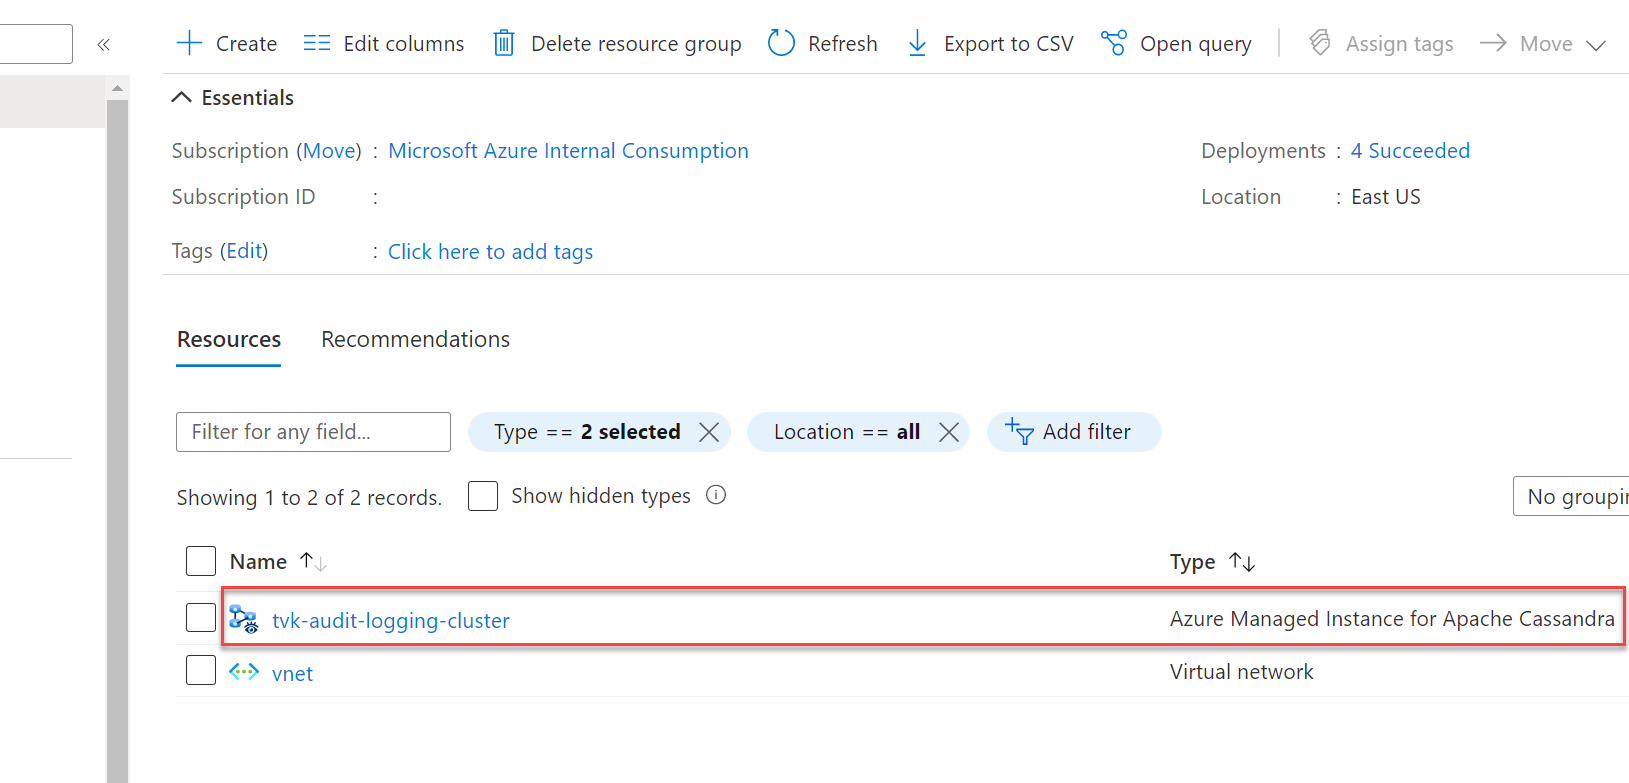
转到你的 Azure Managed Instance for Apache Cassandra 群集资源。
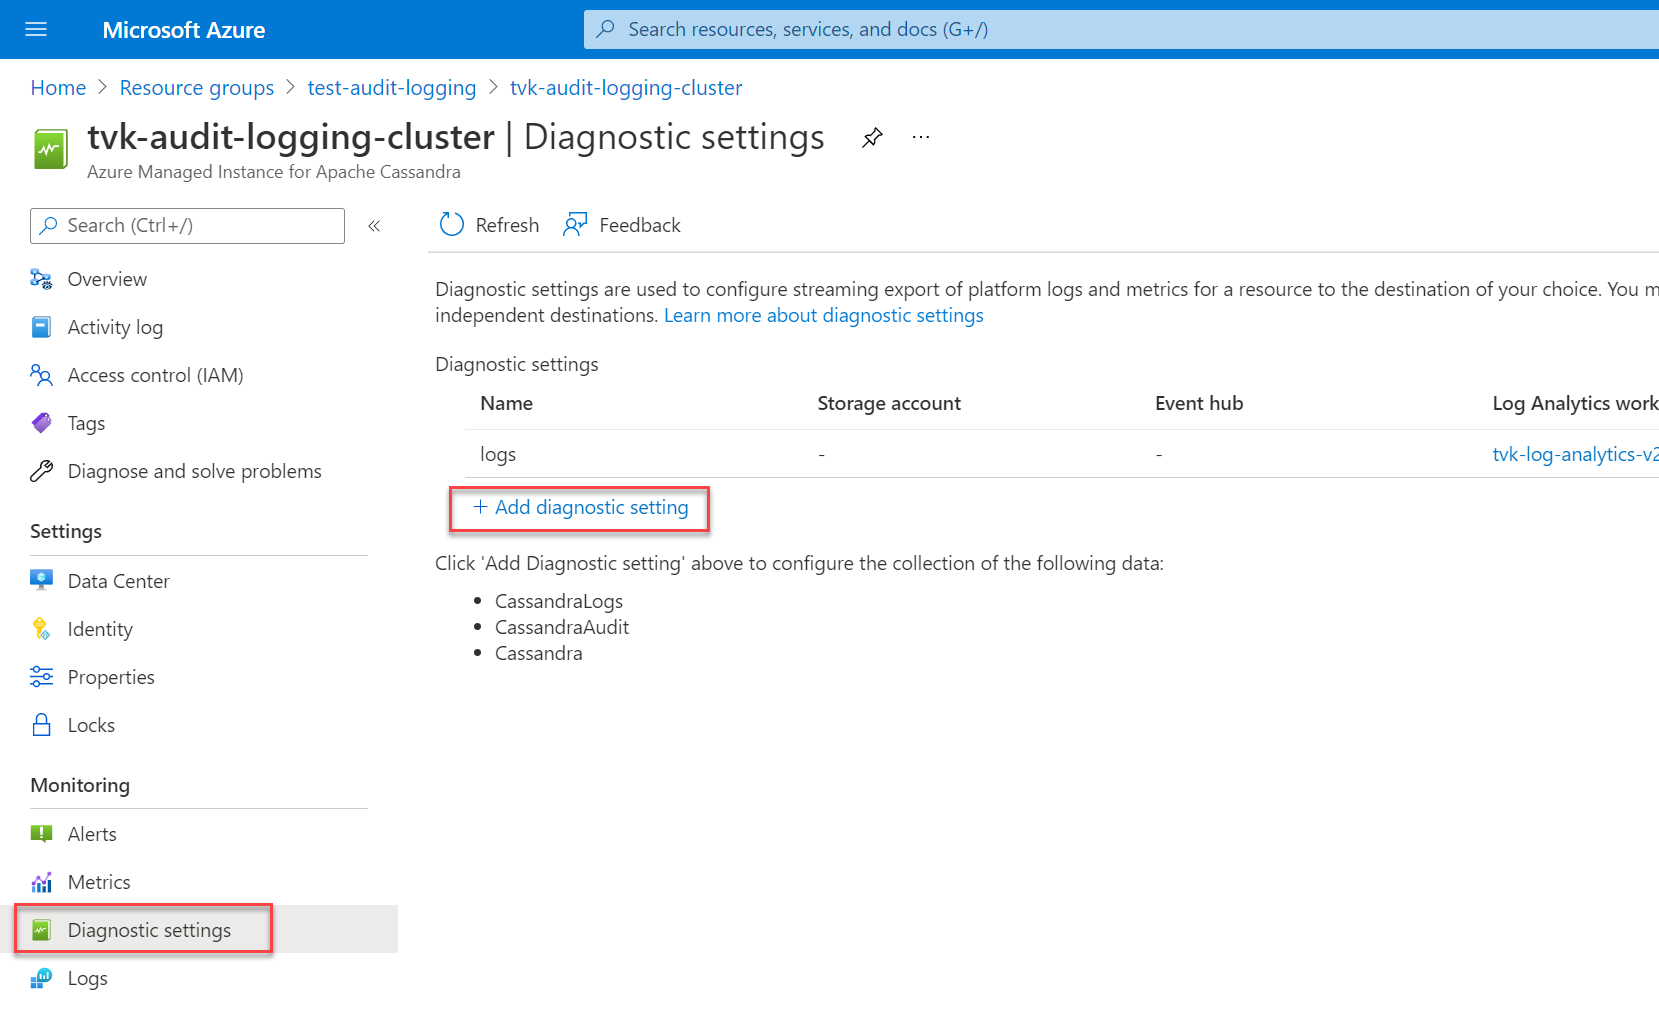
在“监视”部分选择“诊断设置”,然后选择“添加诊断设置”。
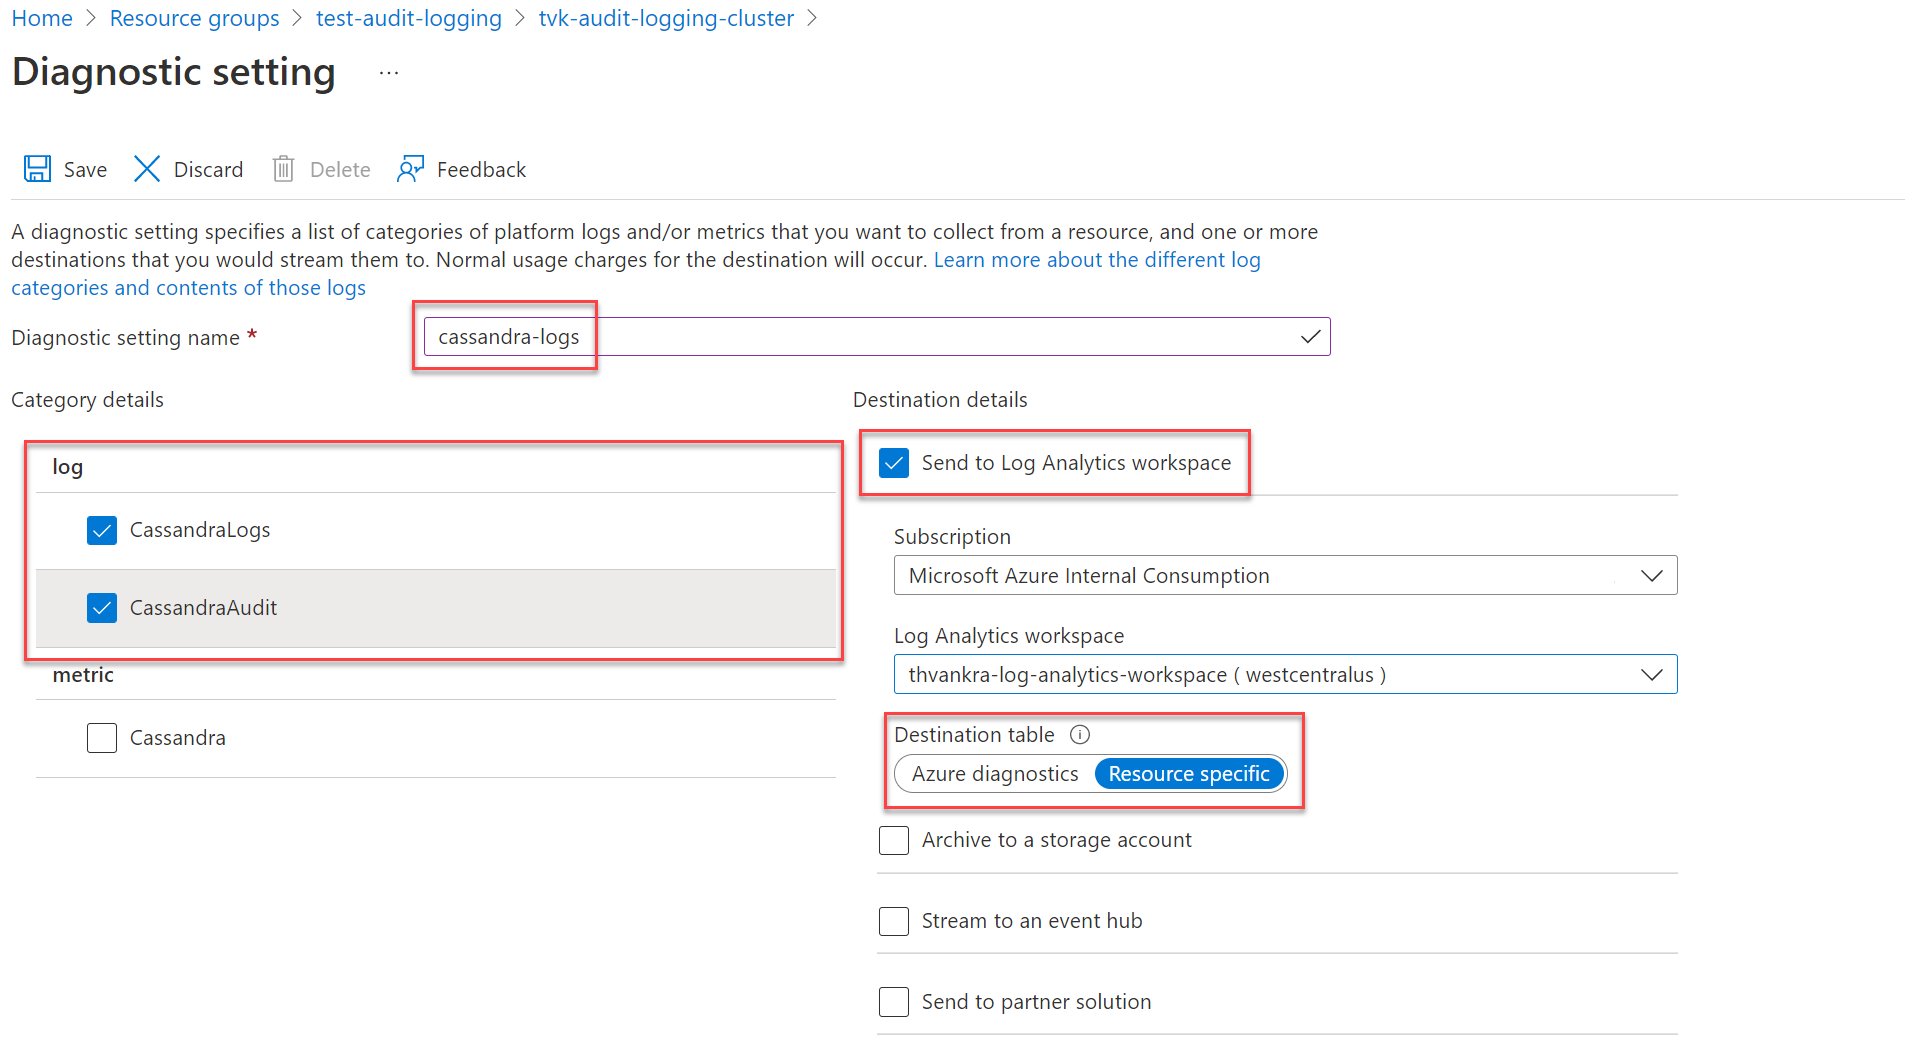
在“诊断设置”窗格中,选择你的设置名称。
然后,在“类别详细信息”下选择你的类别。 CassandraLogs 类别记录 Cassandra 服务器操作。 “CassandraAudit”类别记录审核和 Cassandra 查询语言 (CQL) 操作。
在“目标详细信息”下,选择日志的首选目标。 如果要将日志发送到 Log Analytics 工作区,请确保选择“特定于资源”作为目标表。
注意
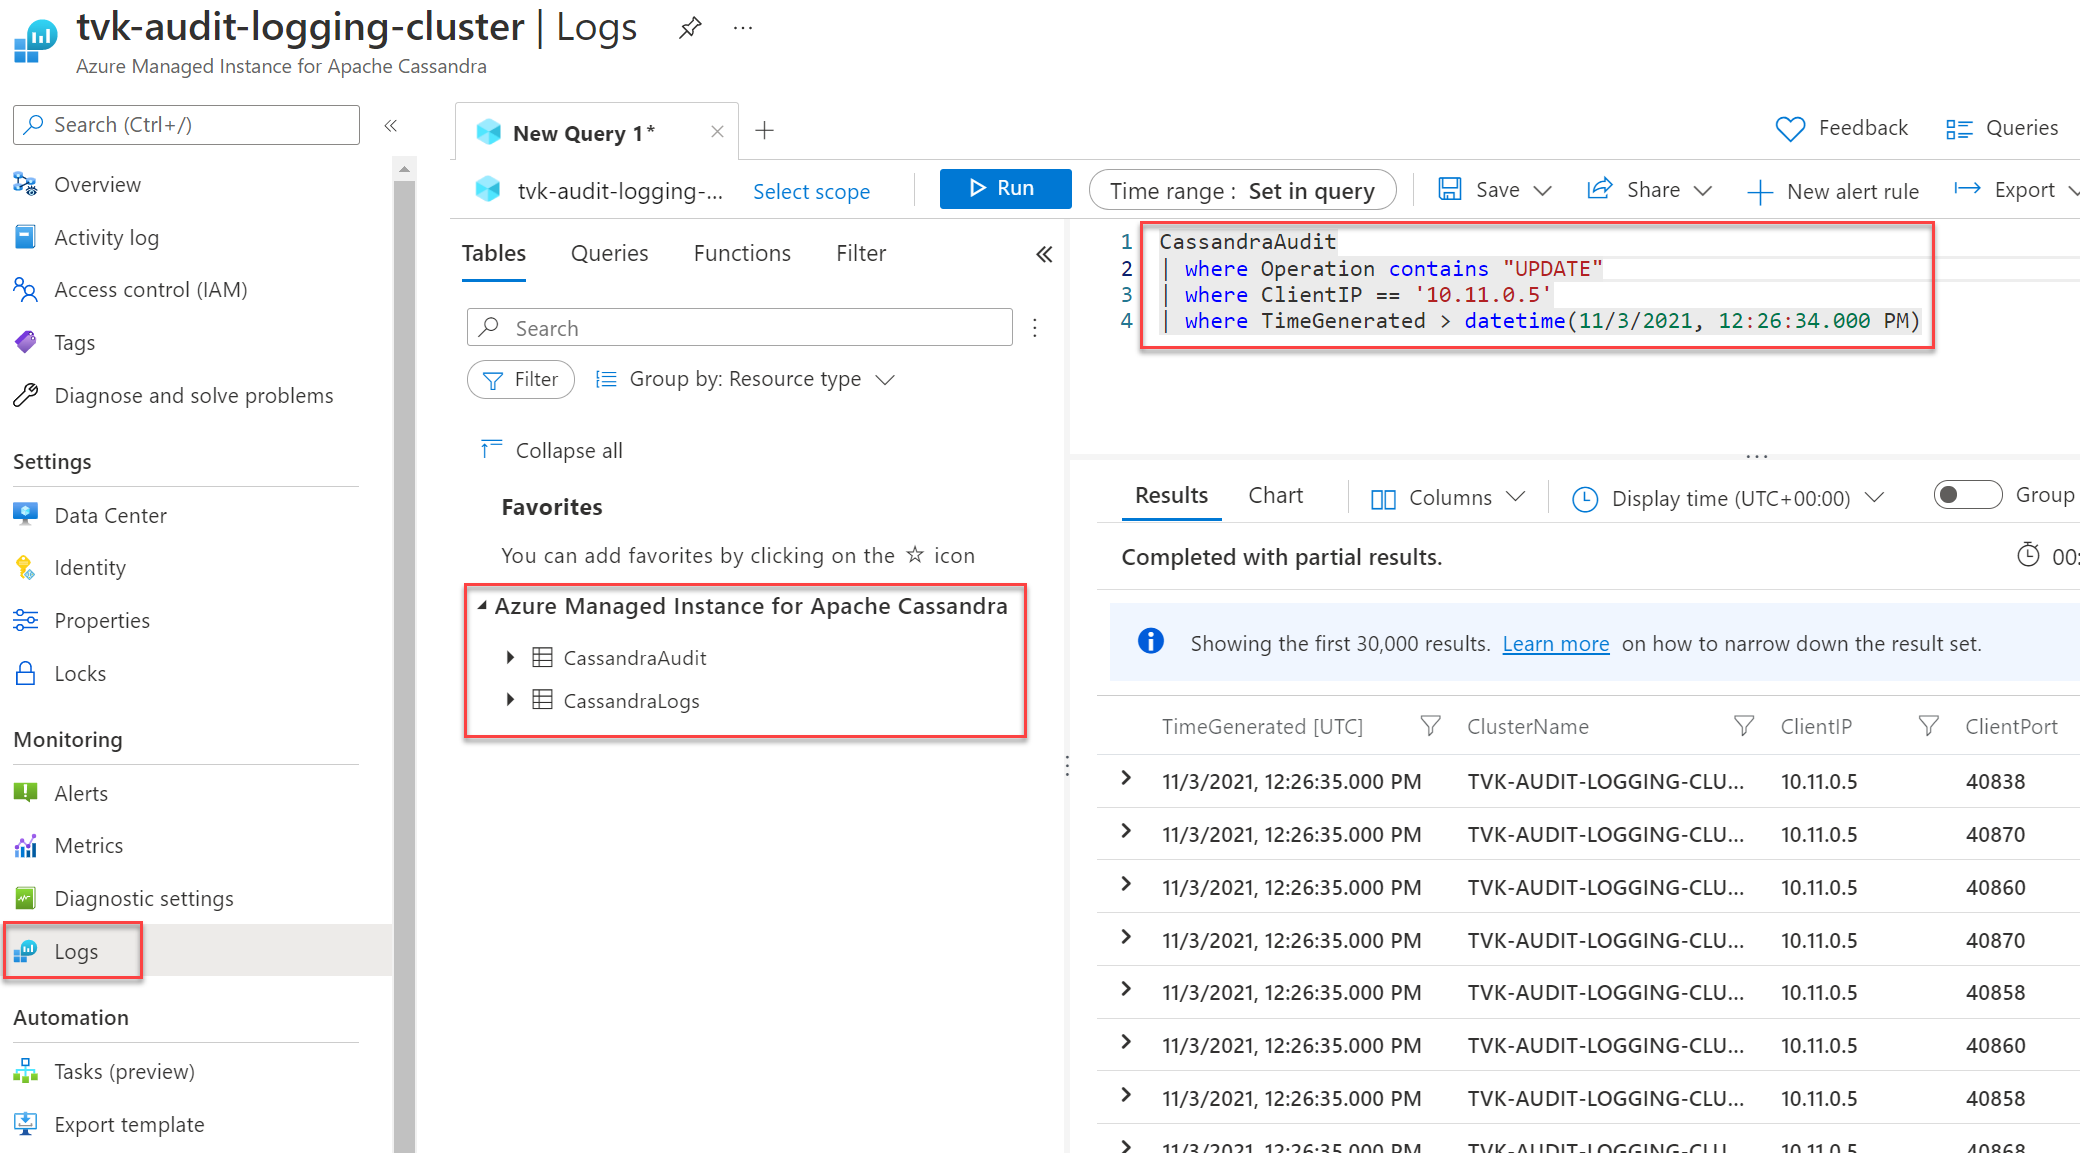
如果将日志发送到 Log Analytics 工作区,它们最多可能需要在 20 分钟后才会显示出来。 在此之前,特定于资源的表(如“Azure Managed Instance for Apache Cassandra”下所示)将不可见。
设置诊断日志记录并且数据流动后,可以选择“日志”并使用 Azure 数据资源管理器查询可用的诊断日志。 有关 Azure Monitor 和 Kusto 查询语言的详细信息,请参阅 Azure Monitor 中的日志查询。
通过 Azure CLI 创建诊断设置
若要使用 Azure CLI 创建诊断设置,请使用 az monitor diagnostic-settings create 命令:
    logs='[{"category":"CassandraAudit","enabled":true,"retentionPolicy":{"enabled":true,"days":3}},{"category":"CassandraLogs","enabled":true,"retentionPolicy":{"enabled":true,"days":3}}]'
    resourceId='/subscriptions/{SUBSCRIPTION_ID}/resourceGroups/{RESOURCE_GROUP}/providers/Microsoft.DocumentDB/cassandraClusters/{CLUSTER_NAME}'
    workspace='/subscriptions/{SUBSCRIPTION_ID}/resourcegroups/{RESOURCE_GROUP}/providers/microsoft.operationalinsights/workspaces/{WORKSPACE_NAME}'

    az monitor diagnostic-settings create  --name tvk-diagnostic-logs-cassandra --resource $resourceId --logs  $logs --workspace $workspace --export-to-resource-specific true
通过 REST API 创建诊断设置
使用 Azure Monitor REST API 通过交互式控制台创建诊断设置。
注意
建议将 logAnalyticsDestinationType 属性设置为 Dedicated,以启用特定于资源的表。
请求
PUT
https://management.azure.com/{resource-id}/providers/microsoft.insights/diagnosticSettings/service?api-version={api-version}
头文件
| 参数/标头 | 值/说明 |
|---|---|
name |
诊断设置的名称 |
resourceUri |
subscriptions/{SUBSCRIPTION_ID}/resourceGroups/{RESOURCE_GROUP}/providers/Microsoft.DocumentDb/databaseAccounts/{ACCOUNT_NAME}/providers/microsoft.insights/diagnosticSettings/{DIAGNOSTIC_SETTING_NAME} |
api-version |
2017-05-01-preview |
Content-Type |
application/json |
Body
{
    "id": "/subscriptions/{SUBSCRIPTION_ID}/resourceGroups/{RESOURCE_GROUP}/providers/Microsoft.DocumentDb/databaseAccounts/{ACCOUNT_NAME}/providers/microsoft.insights/diagnosticSettings/{DIAGNOSTIC_SETTING_NAME}",
    "type": "Microsoft.Insights/diagnosticSettings",
    "name": "name",
    "location": null,
    "kind": null,
    "tags": null,
    "properties": {
        "storageAccountId": null,
        "serviceBusRuleId": null,
        "workspaceId": "/subscriptions/{SUBSCRIPTION_ID}/resourcegroups/{RESOURCE_GROUP}/providers/microsoft.operationalinsights/workspaces/{WORKSPACE_NAME}",
        "eventHubAuthorizationRuleId": null,
        "eventHubName": null,
        "logs": [
            {
                "category": "CassandraAudit",
                "categoryGroup": null,
                "enabled": true,
                "retentionPolicy": {
                    "enabled": false,
                    "days": 0
                }
            },
            {
                "category": "CassandraLogs",
                "categoryGroup": null,
                "enabled": true,
                "retentionPolicy": {
                    "enabled": false,
                    "days": 0
                }
            }
        ],
        "logAnalyticsDestinationType": "Dedicated"
    },
    "identity": null
}
审核允许列表
注意
本文包含对术语允许列表的引用,Microsoft 不再使用该术语。 在从软件中删除该术语后,我们会将其从本文中删除。
默认情况下,审核日志会为每次登录尝试和 CQL 查询创建一条记录。 结果数量可能非常多,这会增加开销。 为了处理这种情况,可以使用允许列表来选择性地包含或排除特定的审核记录。
Cassandra 3.11
在 Cassandra 3.11 中,可以使用审核允许列表功能来设置哪些操作不会创建审核记录。 Cassandra 3.11 中默认启用审核允许列表功能。 若要了解如何配置允许列表,请参阅基于角色的允许列表管理。
示例:
若要从审核日志中筛选出用户
bob的所有SELECT和MODIFY操作,请执行以下语句:cassandra@cqlsh> ALTER ROLE bob WITH OPTIONS = { 'GRANT AUDIT WHITELIST FOR SELECT' : 'data' }; cassandra@cqlsh> ALTER ROLE bob WITH OPTIONS = { 'GRANT AUDIT WHITELIST FOR MODIFY' : 'data' };若要从审核日志中筛选出用户
jim的design键空间中针对decisions表的所有SELECT操作,请执行以下语句:cassandra@cqlsh> ALTER ROLE jim WITH OPTIONS = { 'GRANT AUDIT WHITELIST FOR SELECT' : 'data/design/decisions' };若要撤销用户
bob对所有用户SELECT操作的允许列表,请执行以下语句:cassandra@cqlsh> ALTER ROLE bob WITH OPTIONS = { 'REVOKE AUDIT WHITELIST FOR SELECT' : 'data' };若要查看当前的允许列表,请执行以下语句:
cassandra@cqlsh> LIST ROLES;
Cassandra 4 及更高版本
在 Cassandra 4 及更高版本中,可以在 Cassandra 配置中配置允许列表。 有关详细指导,请参阅更新 Cassandra 配置。 可用选项如下(参考:审核日志记录的 Cassandra 文档):
audit_logging_options:
    included_keyspaces: <Comma separated list of keyspaces to be included in audit log, default - includes all keyspaces>
    excluded_keyspaces: <Comma separated list of keyspaces to be excluded from audit log, default - excludes no keyspace except system, system_schema and system_virtual_schema>
    included_categories: <Comma separated list of Audit Log Categories to be included in audit log, default - includes all categories>
    excluded_categories: <Comma separated list of Audit Log Categories to be excluded from audit log, default - excludes no category>
    included_users: <Comma separated list of users to be included in audit log, default - includes all users>
    excluded_users: <Comma separated list of users to be excluded from audit log, default - excludes no user>
可用类别包括:QUERY、DML、DDL、DCL、OTHER、AUTH、ERROR、PREPARE。
下面是一个配置示例:
audit_logging_options:
    included_keyspaces: keyspace1,keyspace2
    included_categories: AUTH,ERROR,DCL,DDL
默认情况下,配置将 included_categories 设置为 AUTH,ERROR,DCL,DDL。
后续步骤
- 有关如何使用 Azure 门户、Azure CLI 或 PowerShell 创建诊断设置的详细信息,请参阅 Azure Monitor 中的诊断设置。