
As containerized environments continue to grow in complexity, it can be increasingly challenging to identify the root cause of networking issues within a Kubernetes cluster. Intermittent failures and performance bottlenecks can be particularly frustrating, and gaining comprehensive visibility into the networking infrastructure can often seem like a daunting task. Many organizations find themselves grappling with these challenges, struggling to find effective solutions to address them.
To address these, we are pleased to announce the availability of Azure Kubernetes Service (AKS)—Network Observability. This feature provides customers with powerful capabilities to gain enhanced visibility into their container network traffic. By providing real-time insights and comprehensive networking metrics, this feature empowers administrators and developers to effectively troubleshoot networking issues and optimize performance of their containerized applications.
In this blog post, we will delve into the details of this exciting new network observability feature in AKS. We will explore its capabilities, use cases, and discuss the benefits of this feature.
What is Network Observability for AKS
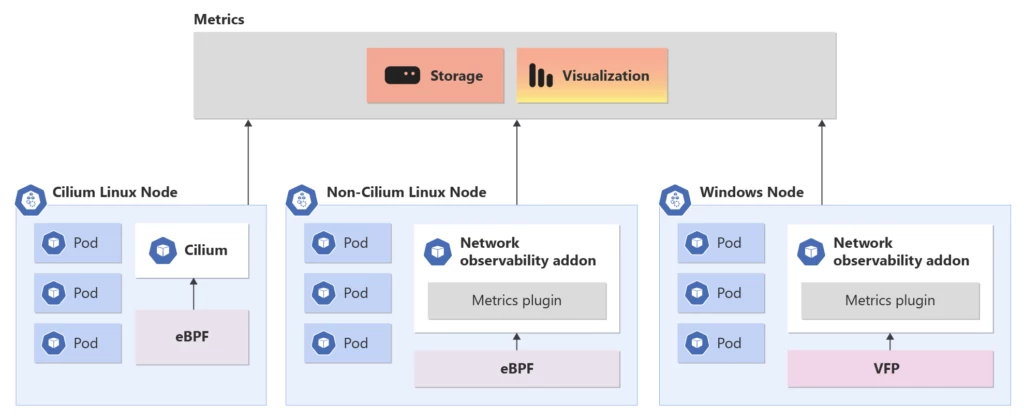
Network observability feature in AKS is a distributed monitoring solution which works for both Linux and Windows hosting environments. This add-on gains insight into networking infrastructure by collecting real-time data points leveraging eBPF in Linux, Virtual Filtering Platform (VFP), and Host Networking Service (HNS) in Windows and provides them to be consumed in Prometheus and Grafana.
Visualizing network observability data
Azure Managed Prometheus and Grafana:
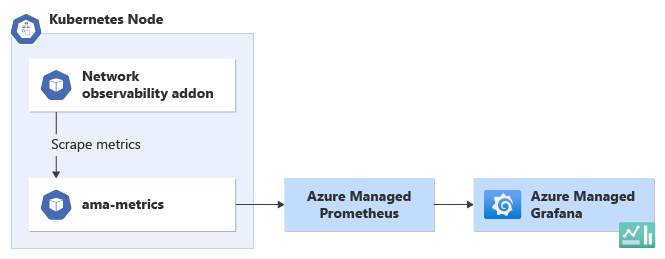
With the Azure-managed Prometheus and Grafana approach, Microsoft Azure offers integrated services that simplify the setup and management of monitoring and visualization. Azure Monitor provides a managed instance of Prometheus, which collects and stores metrics from various sources, including the network observability addon. Grafana, a popular open-source platform for data visualization, is seamlessly integrated with Azure Monitor. Users can leverage pre-configured dashboards and templates specifically designed for AKS and the network observability addon. These dashboards provide a comprehensive view of network metrics, allowing users to monitor and analyze the data in a visually appealing and intuitive manner.
To set up network observability using Azure-managed Prometheus and Grafana approach, users can follow the Azure documentation. Once configured, they can access the Grafana interface to explore the predefined dashboards or create custom visualizations tailored to their specific requirements. The integration between Azure Monitor, Prometheus, and Grafana streamlines the process of visualizing network observability data, making it easier for users to gain valuable insights into their AKS cluster’s network performance.
Bring your own (BYO) Prometheus and Grafana:
(For advanced users comfortable with increased management overhead)
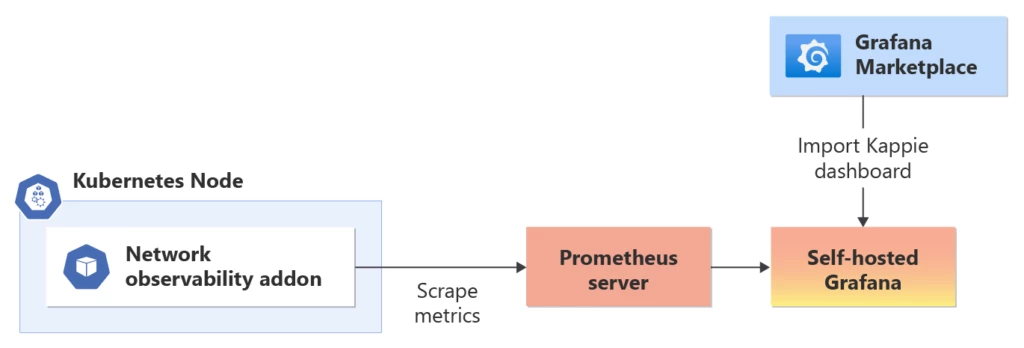
Alternatively, users have the option to set up and manage their own Prometheus and Grafana instances. This approach provides more flexibility and control over the configuration and customization of the monitoring and visualization stack. Users can deploy Prometheus and Grafana as separate components within their infrastructure or use containerized versions running alongside their AKS cluster.
Setting up a BYO Prometheus involves configuring Prometheus to scrape the metrics exposed by the network observability addon. Users can define scrape configurations to collect the relevant metrics and store them in Prometheus’s time-series database. Grafana can then be connected to Prometheus to create custom dashboards and visualizations. Users can design their own Grafana dashboards or import community-provided templates to visualize the network observability metrics based on their specific monitoring needs and preferences. Users can follow the Azure documentation to enable Network observability add-on to and visualize using BYO Prometheus and Grafana.
By using BYO Prometheus and Grafana, users have complete control over the deployment, configuration, and customization of their monitoring and visualization stack. This approach allows for more advanced and tailored visualizations of network observability data, empowering users to design insightful dashboards that align with their unique monitoring requirements.
Use cases
Customer scenario 1: Network policy drops
Debugging network policies in large, intricate clusters with multiple namespaces can be a daunting task, especially when there are numerous network policies per namespace. To address this challenge, the network policy addon leverages eBPF in Linux to collect crucial information about dropped packets. By attaching kprobes at various critical locations in the Linux kernel, such as the netfilter drop function and the netfilter nat function, the network policy addon effectively determines if a packet is being dropped.
When a dropped packet is detected, the associated eBPF programs generate an event that includes packet metadata, along with the drop reason and location. This event is then processed by a userspace program, which parses the data and converts it into Prometheus metrics. These metrics offer valuable insights into the dropped packets, aiding in the identification and resolution of network policy configuration issues.
In Windows, the VFP and HNS provide counters for Access Control List (ACL), or endpoint rule drops. Our network observability addon scrapes these counters and converts the data into Prometheus metrics, ensuring consistent and comprehensive monitoring across different platforms.
To illustrate the capabilities of our solution, consider the following example, showcasing dropped packets with various reasons, such as iptables or ACL:
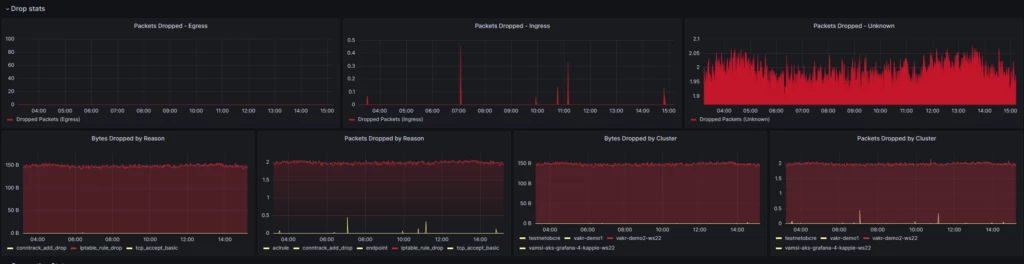
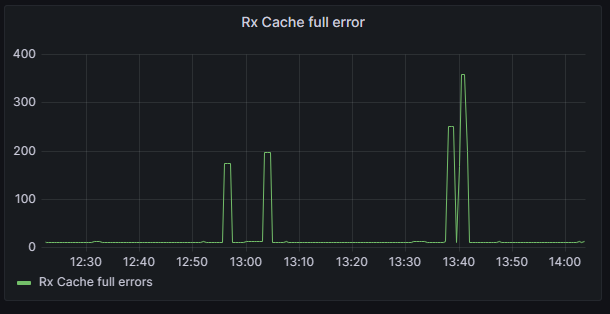
Customer scenario 2: Receive Cache full
In Azure, accelerated networking is enabled by default for almost all Linux virtual machines (VMs). With the introduction of Accelerated Networking, each network interface is allocated a dedicated memory space for receiving packets. The network observability addon plays a crucial role in monitoring this memory allocation by examining the Rx Cache full statistic on each interface and converting it into Prometheus metrics. By doing so, users gain valuable insights into the performance of their network interfaces.
The diagram below illustrates a specific scenario where a VM is operating at its maximum capacity, receiving packets at the line rate. In such cases, users may experience intermittent latency spikes or packet drops. By quickly correlating this information with the provided graph, it becomes evident that when the “Rx buffer full” metric spikes, the network interface’s receive buffer becomes saturated, potentially leading to packet drops or an increase in latency for packets awaiting processing.
Benefits
Enhanced network visibility: The network observability addon empowers users to gain deep visibility into their network infrastructure, enabling them to identify and troubleshoot issues related to network policies, packet drops, latency spikes, and other performance-related issues.
Improved debugging capabilities: By leveraging eBPF and other monitoring mechanisms, the addon provides valuable insights into network policy configurations, enabling efficient debugging and troubleshooting. Users can quickly identify misconfigured network policies and resolve them promptly.
Real-time monitoring and alerting: With the conversion of network observability metrics into Prometheus metrics, users can monitor their network performance in real-time. They can set up alerts and notifications to proactively address any anomalies, ensuring high availability and optimal performance of their network infrastructure.
Platform compatibility: The network observability addon is designed to work seamlessly across different platforms, including Linux and Windows. This compatibility allows users to maintain a consistent monitoring experience across their infrastructure, regardless of the underlying operating system.
Multi-Cluster Historical View: Enabling multiple Clusters with network observability addon and connecting them to same Azure managed Prametheus and Grafana will facilitate in a single pane of glass to visualize all your clusters’ networking performance over time.
Learn more
Read more in the network observability add-on documentation and you can also watch a demo on Microsoft’s Azure YouTube channel.
- Learn more about Azure Kubernete Service.
- Explore Azure Linux to gain more insight.
- Discover more about Azure Monitor.