Hybrid + Multicloud, Networking, expressroute
Monitor Microsoft peering in ExpressRoute with Network Performance Monitor – public preview
Posted on
2 min read
We are excited to announce the public preview of Network Performance Monitor’s (NPM) new capability to monitor Microsoft peering in ExpressRoute. This complements NPM’s generally available capability to monitor ExpressRoute’s Azure Private peering. Throughout this post, I will walk you through some of the important use cases of the capability.
Get complete visibility into the ExpressRoute connection to the Microsoft services
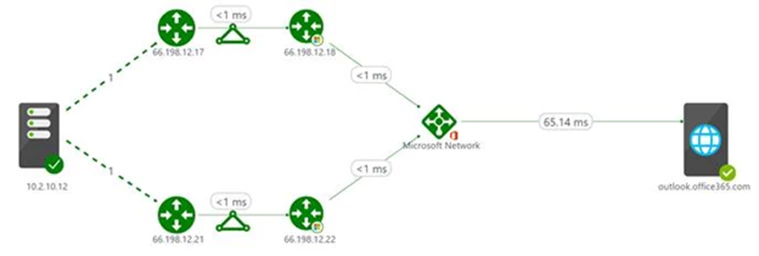
It can become extremely difficult to identify the bottleneck when a performance degradation is experienced while accessing a Microsoft service over ExpressRoute. This is because an ExpressRoute connection comprises of various components. With this capability, you can now get the required end-to-end visibility through NPM’s interactive topology view. You can not only view all the constituent components – on-premises network, circuit provider edge, ExpressRoute circuit, Microsoft edge, but also the latency contributed by each hop to help you identify the troublesome segment.
The following snippet illustrates a topology view where the on-premises computer on the left is connected to the Microsoft service (outlook.office365.com) on the right, over primary and secondary ExpressRoute Microsoft peering connections. The service provider router at the customer edge and the Microsoft router at the Azure edge are also depicted. The on-premises hops (depicted by dashed lines) are initially compressed. From this map, you can view the latency contributed by each segment and identify the troublesome hop. You can also choose to expand the map to view all the on-premises hops and understand the latency contributed by them.

Monitor connectivity to Microsoft online services, over ExpressRoute
You can now monitor the end-to-end connectivity between your on-premises resources (branch offices, datacenters, and office sites) and Microsoft online services (Office 365, Dynamics 365, and Azure PaaS services) connected through an ExpressRoute. NPM proactively sends you alert notifications whenever the loss and latency of the connection shoots over the set threshold. You can catch transient issues by observing the performance trend charts, and drill-down deep into historical issues by viewing the past state of the system through the network state recorder.
Understand bandwidth utilization
The capability lets you view the bandwidth utilization trends for your Microsoft peering for both the primary and secondary circuits, and as a result, helps you in capacity planning.

You can also setup alerts to notify when the bandwidth for the peering crosses the threshold.
Diagnose connectivity issues
NPM helps you diagnose several circuit connectivity issues, such as when the circuit is down, traffic is not flowing through the circuit, one of the primary or secondary connections is down, performance degradation due to peak utilization, etc. Visit the Diagnostics section in the ExpressRoute monitoring documentation for more details.
Create custom queries and views
All data that is exposed graphically through NPM’s UI are also available natively in Log Analytics search. You can perform interactive analysis of data in the repository, correlate data from different sources, create custom alerts and views, and export the data to Excel, PowerBI, or a shareable link.
Get started
To get started, see the detailed instructions on how to setup ExpressRoute Monitor in NPM and learn more about the other capabilities in NPM.
Please send your feedback
There are a few different routes to give feedback:
- UserVoice: Post new ideas for Network Performance Monitor on our UserVoice page.
- Join our cohort: We’re always interested in having new customers join our cohorts to get early access to new features and help us improve NPM going forward. If you are interested in joining our cohorts, simply fill out this quick survey.