Analytics, Azure Analysis Services
Azure Analysis Services integration with Azure Diagnostic Logs
Posted on
4 min read
We are pleased to announce that Azure Analysis Services is integrated with Azure Monitor Resource Diagnostic Logs. Diagnostic logging is a key feature for IT owned BI implementations. We have taken steps to ensure you can confidently run diagnostic logging on production Azure Analysis Services servers without a performance penalty.
Various scenarios are supported, including the following:
- Auditing
- Monitoring of server health
- Derivation of usage metrics
- Understanding which user groups are using which datasets and when
- Detection of long-running or problematic queries
- Detection of users experiencing errors
Traditionally, customers have used SSAS Extended Events (xEvents) on premises. This normally involved xEvent session management, output to a binary XEL file, use of special system functions in SQL Server to access the data within the files, and complex parsing of XML output. Having done all that, the data could be stored somewhere and subsequently consumed for analysis. It was often not automatically integrated with other usage data such as performance counter metrics and logs from other components of the architecture. Azure diagnostic logging makes this process simpler and easier for Azure Analysis Services.
Set up diagnostic logging
To set it up, select the “Diagnostic logs” blade for an Azure Analysis Services server in the Azure portal. Then click the add diagnostic setting link.
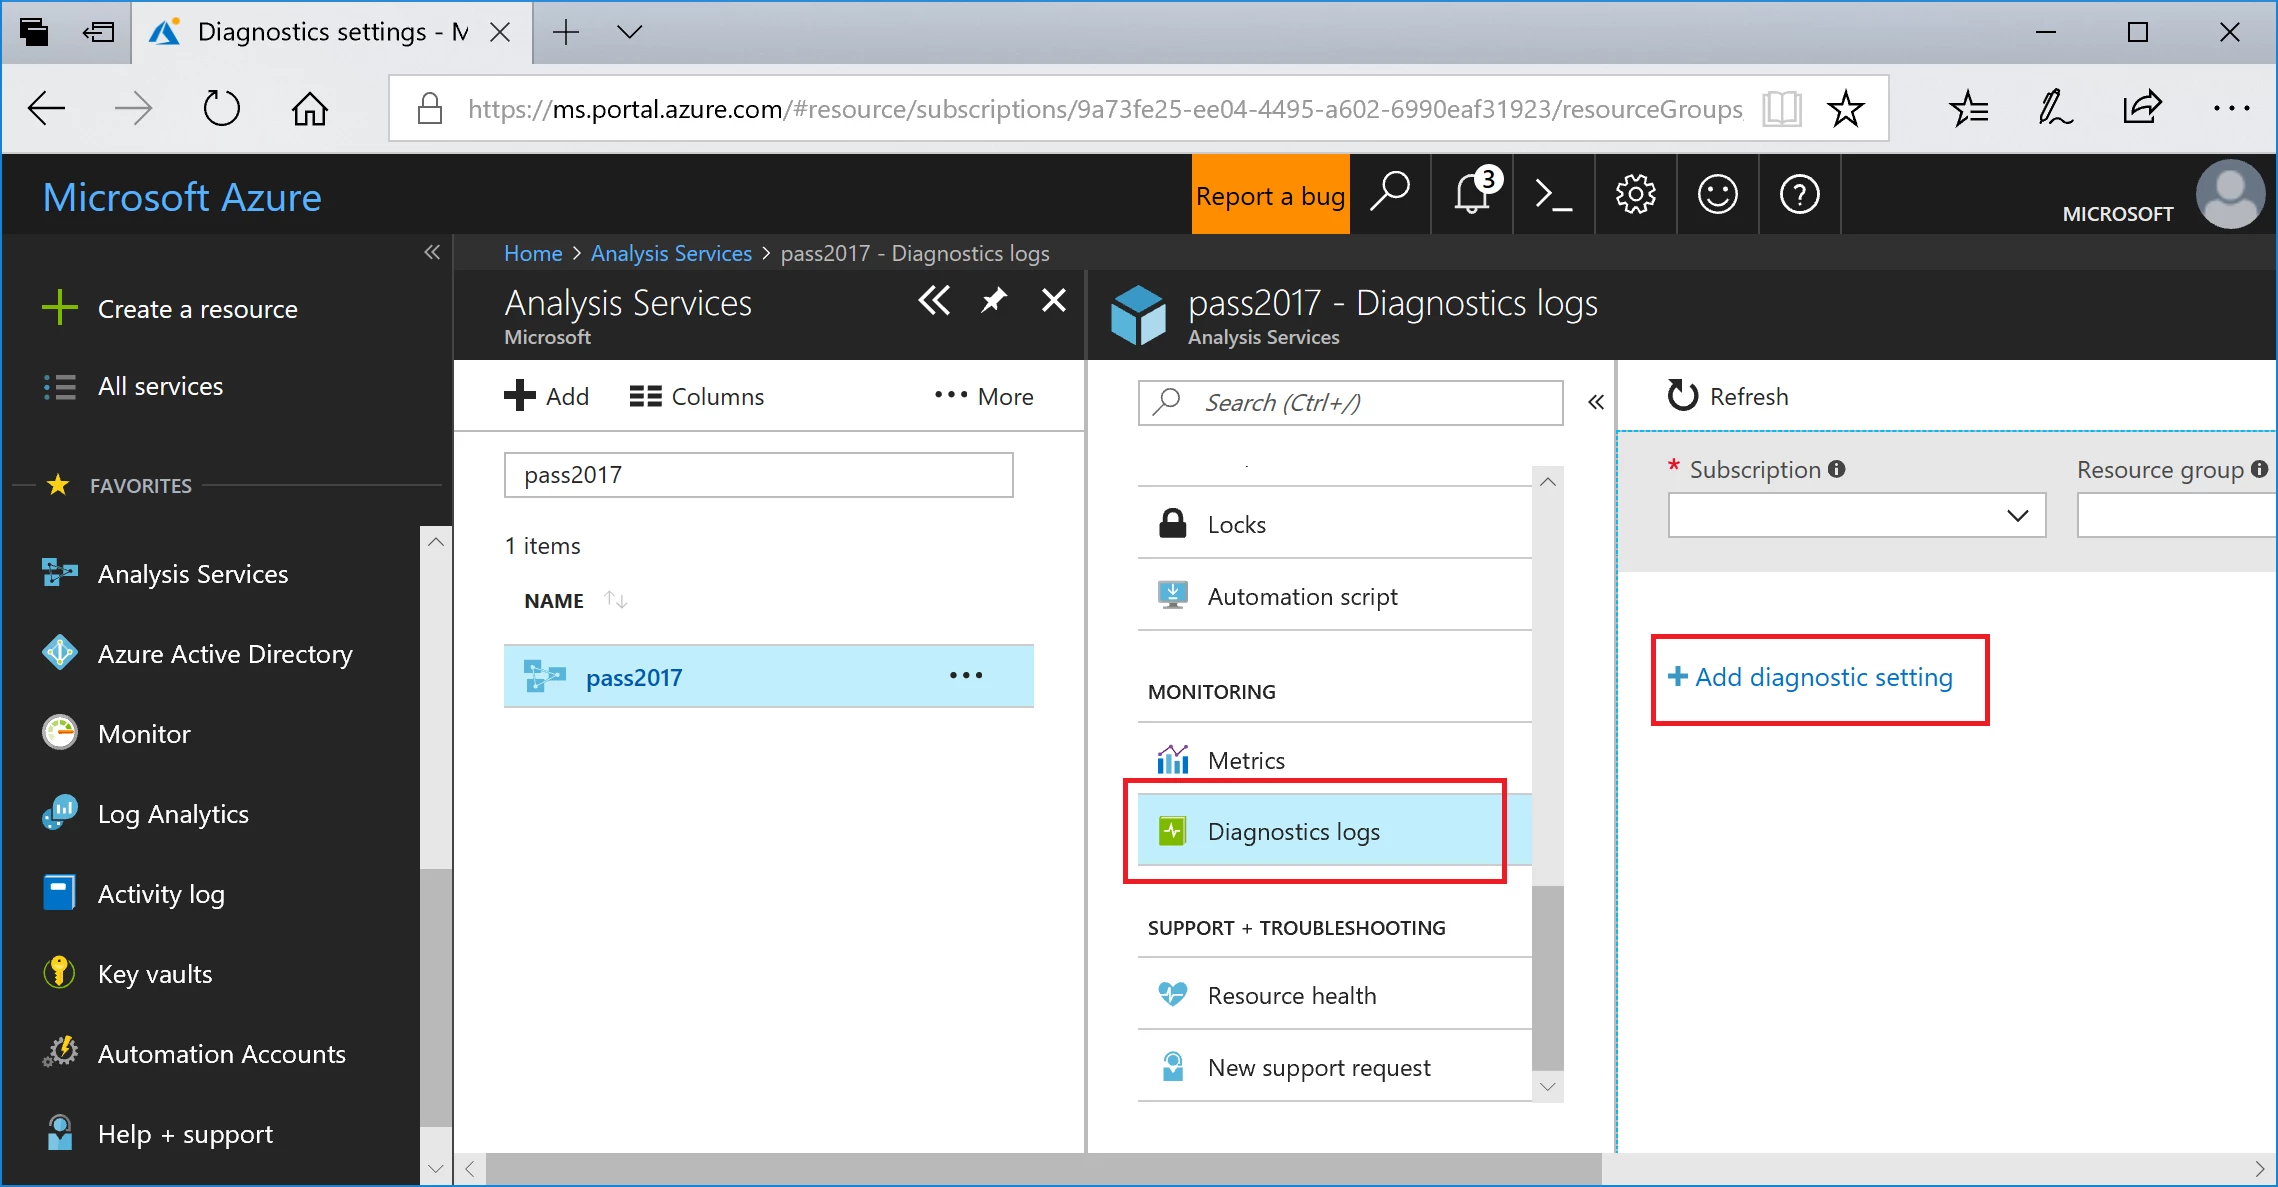
The diagnostic settings blade is displayed.
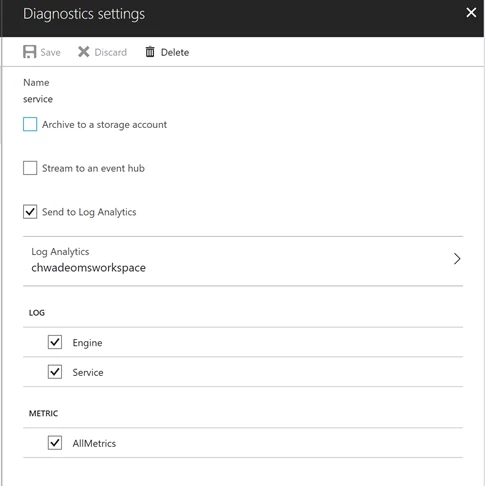
Here you can define up to 3 targets for diagnostic logs.
- Archive to a storage account: Log files are stored in JSON format (not XEL files).
- Stream to an event hub: This allows broad integration with, for example, big-data systems.
- Send to Log Analytics: This leverages the particularly useful Azure Log Analytics, which provides built in analysis, dashboarding and notification capabilities.
The following log categories are available for selection.
- The engine category instructs Azure Analysis Services to log the following xEvents. Unlike xEvents in SSAS, it is not possible to select individual xEvents. The Log Analytics model assumes it is relatively inexpensive to log all the events and ask questions later. We have had feedback from the community that these are the most valuable xEvents, and we have excluded verbose events that can affect server performance. Further xEvents may of course be added in the future, especially when releasing new features.
|
(XEvent) Category |
Event Name |
|
Security Audit |
Audit Login |
|
Security Audit |
Audit Logout |
|
Security Audit |
Audit Server Starts And Stops |
|
Progress Reports |
Progress Report Begin |
|
Progress Reports |
Progress Report End |
|
Progress Reports |
Progress Report Current |
|
Queries |
Query Begin |
|
Queries |
Query End |
|
Commands |
Command Begin |
|
Commands |
Command End |
|
Errors & Warnings |
Error |
|
Discover |
Discover End |
|
Notification |
Notification |
|
Session |
Session Initialize |
|
Locks |
Deadlock |
|
Query Processing |
VertiPaq SE Query Begin |
|
Query Processing |
VertiPaq SE Query End |
|
Query Processing |
VertiPaq SE Query Cache Match |
|
Query Processing |
Direct Query Begin |
|
Query Processing |
Direct Query End |
- The service category includes the following service-level events.
|
Operation name |
Occurs when |
|
CreateGateway |
User configures a gateway on server |
|
ResumeServer |
Resume a server |
|
SuspendServer |
Pause a server |
|
DeleteServer |
Delete a server |
|
RestartServer |
User restarts a server through SSMS or PowerShell |
|
GetServerLogFiles |
User exports server log through PowerShell |
|
ExportModel |
User exports model in Azure Portal. For example, “Open in Power BI Desktop”, “Open in Visual Studio” |
- The All Metrics category logs events for metric readings. These are the same metrics displayed in the Metrics blade of the Azure portal for an Azure Analysis Services server.
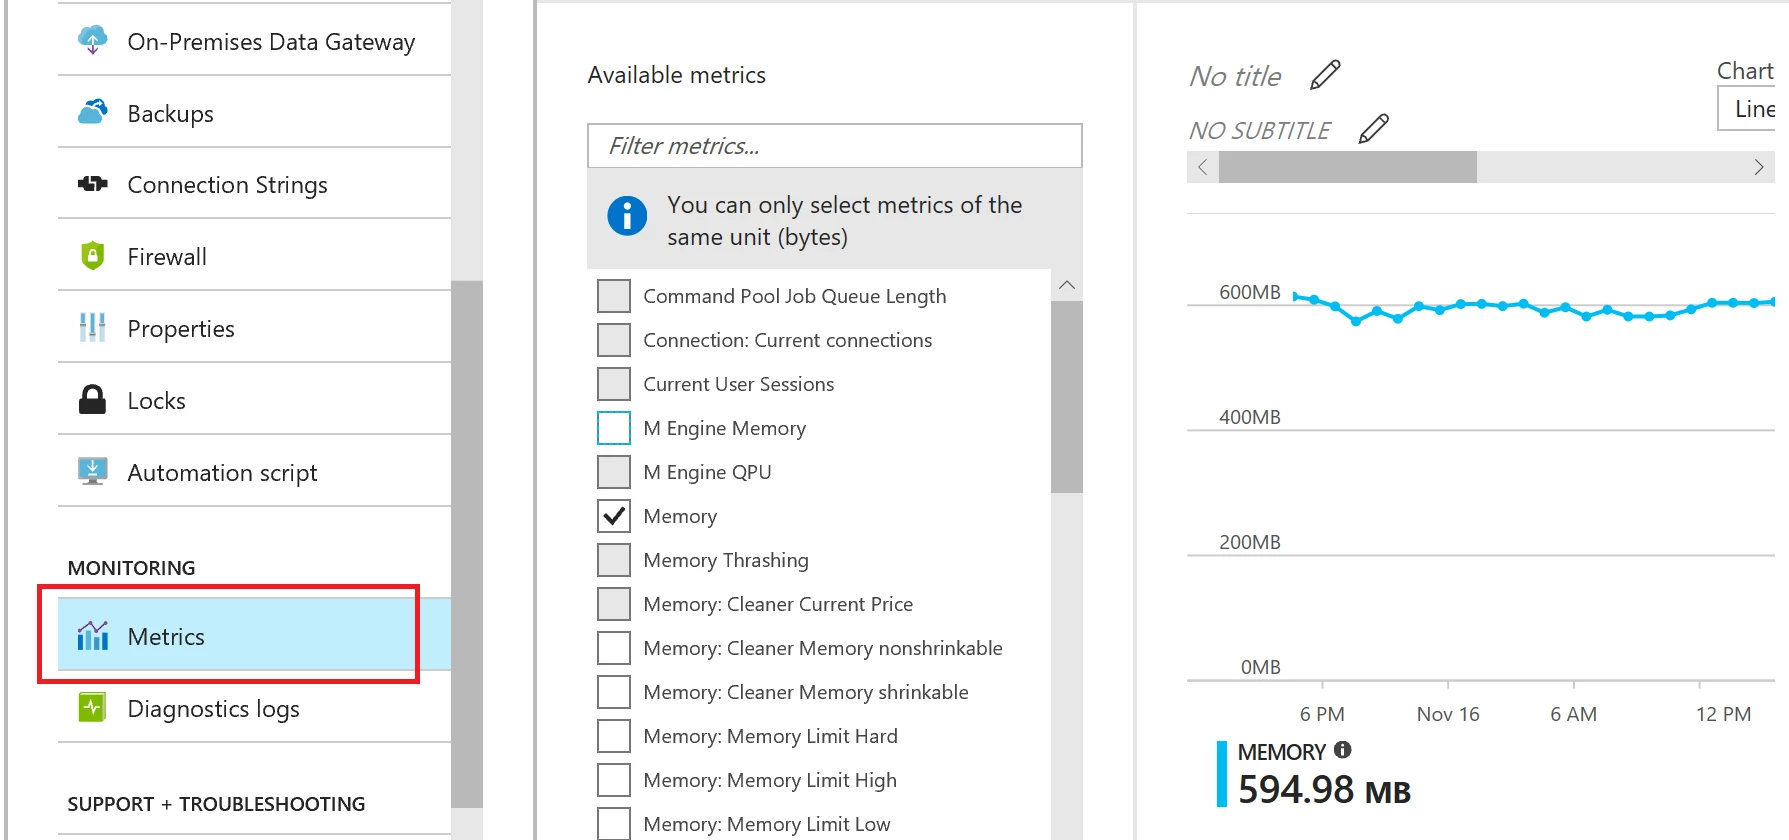
Metrics and server events are integrated with xEvents in Log Analytics for side-by-side analysis. Log Analytics can also be configured to receive events from a range of other Azure services providing a holistic view of diagnostic logging data across customer architectures. Adding the diagnostic setting can be done from PowerShell using the Set-AzureRmDiagnosticSetting cmdlet.
Consume diagnostic logs in Log Analytics
With some log data already generated, navigate to the Log Analytics section of the Azure portal and select the target “OMS workspace”. Then click on Log Search.
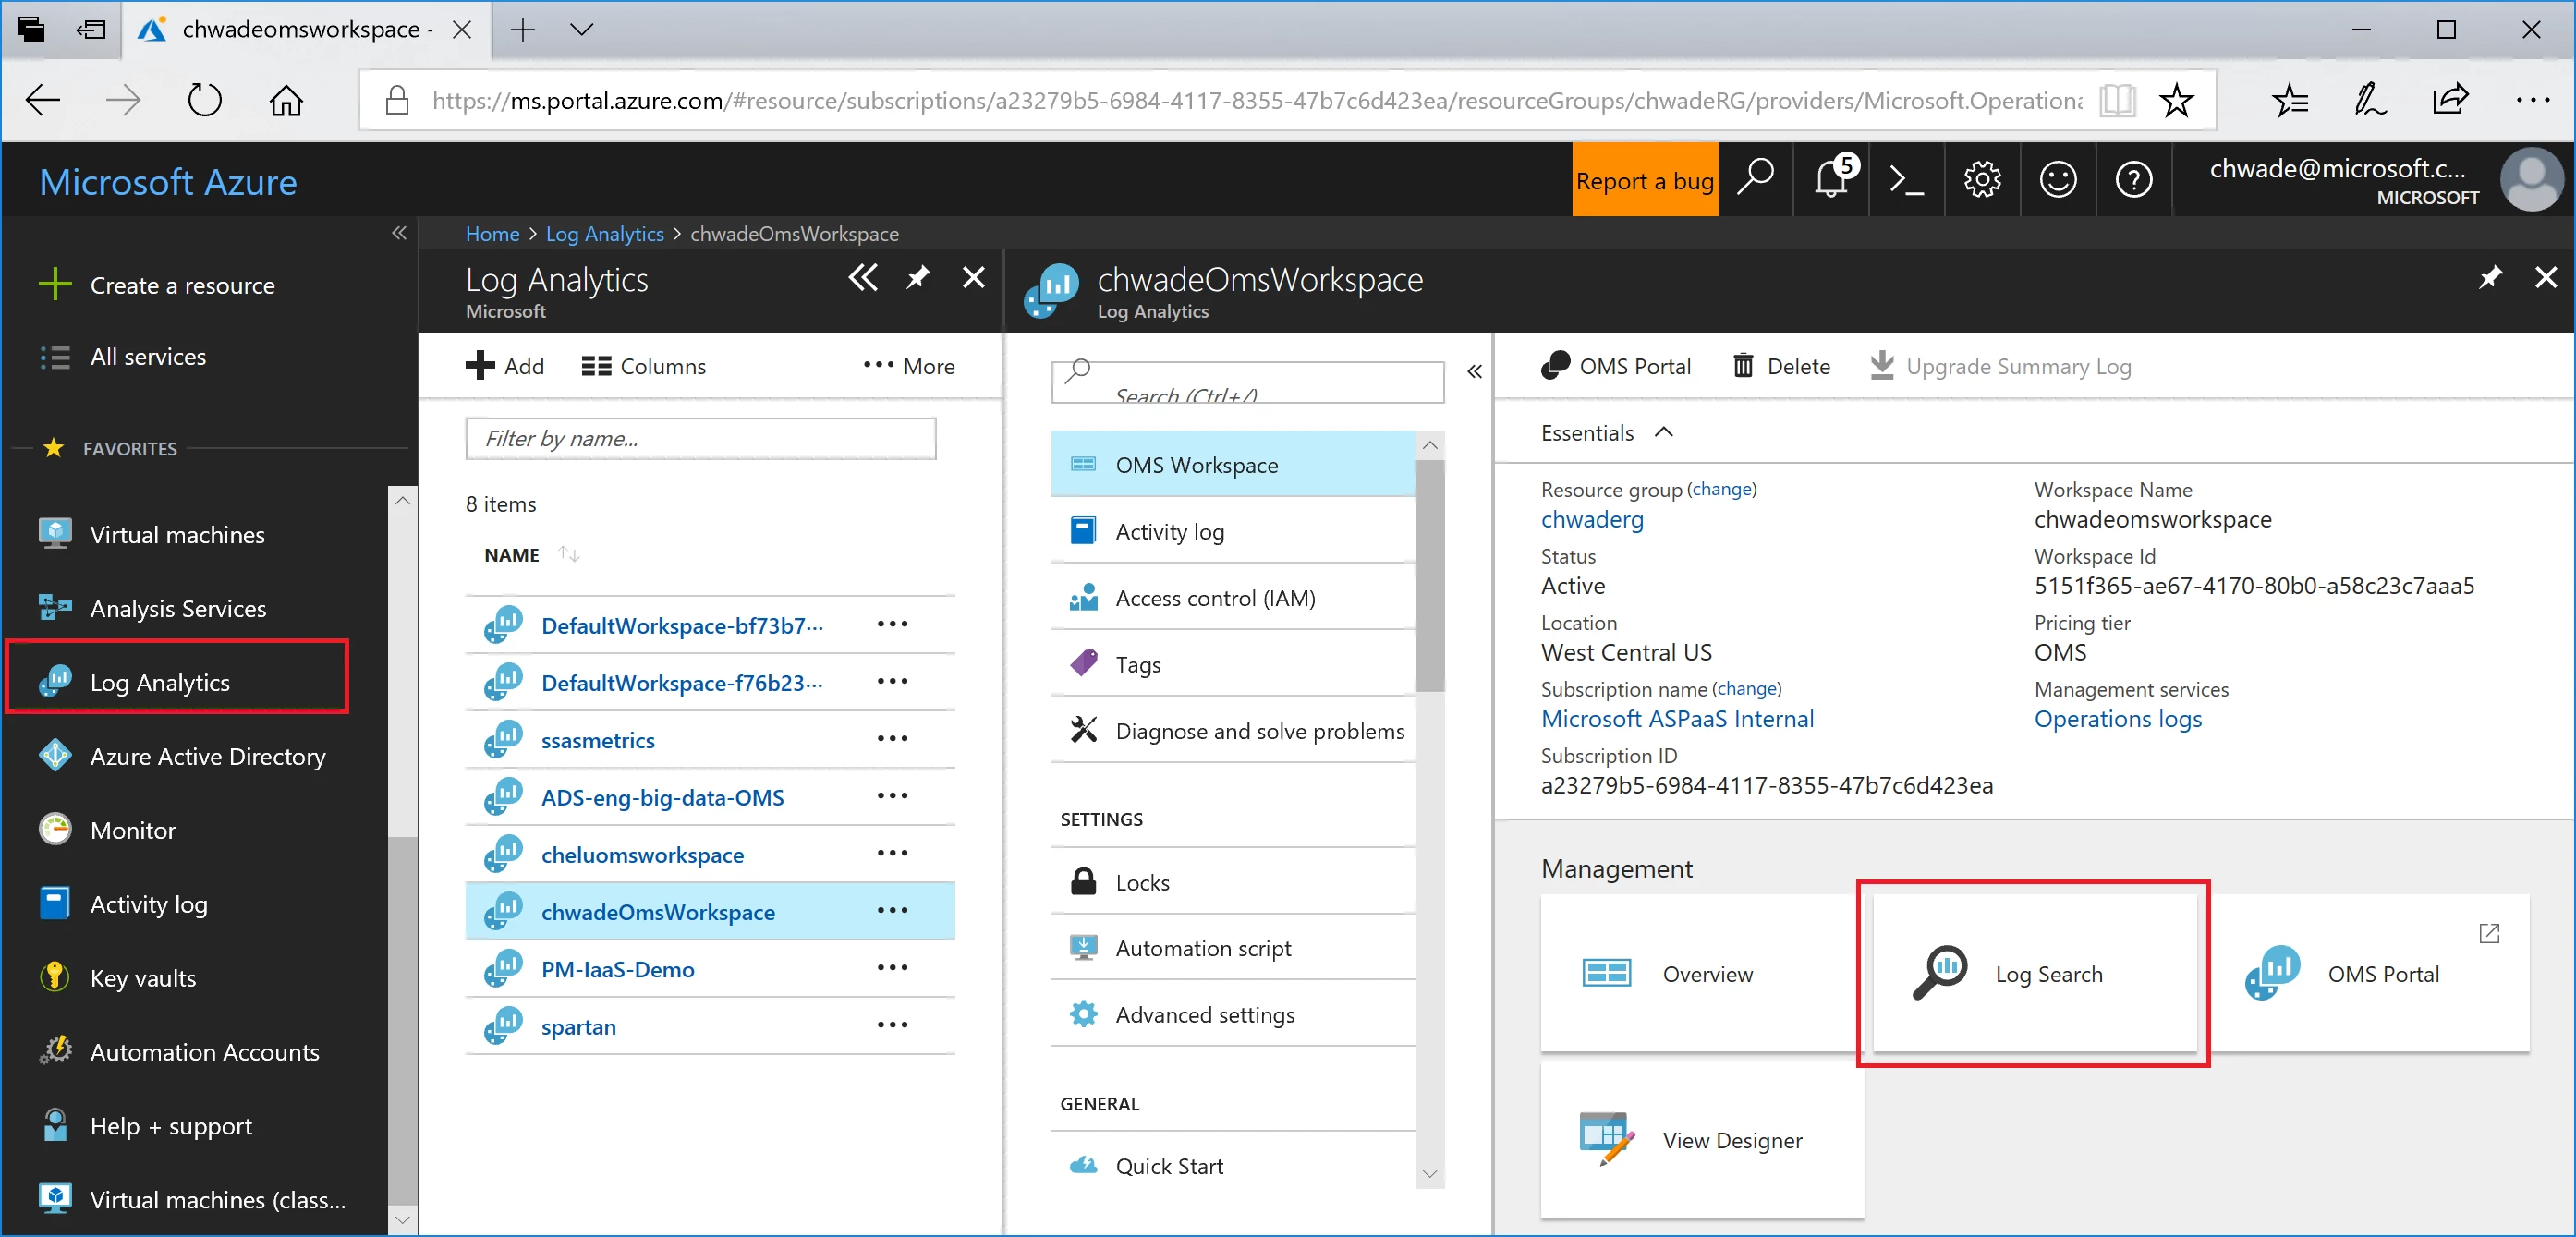
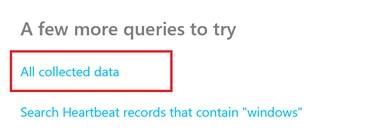
Click on all collected data to get started.
Then, click on AzureDiagnostics and Apply. AzureDiagnostics includes engine and service events.
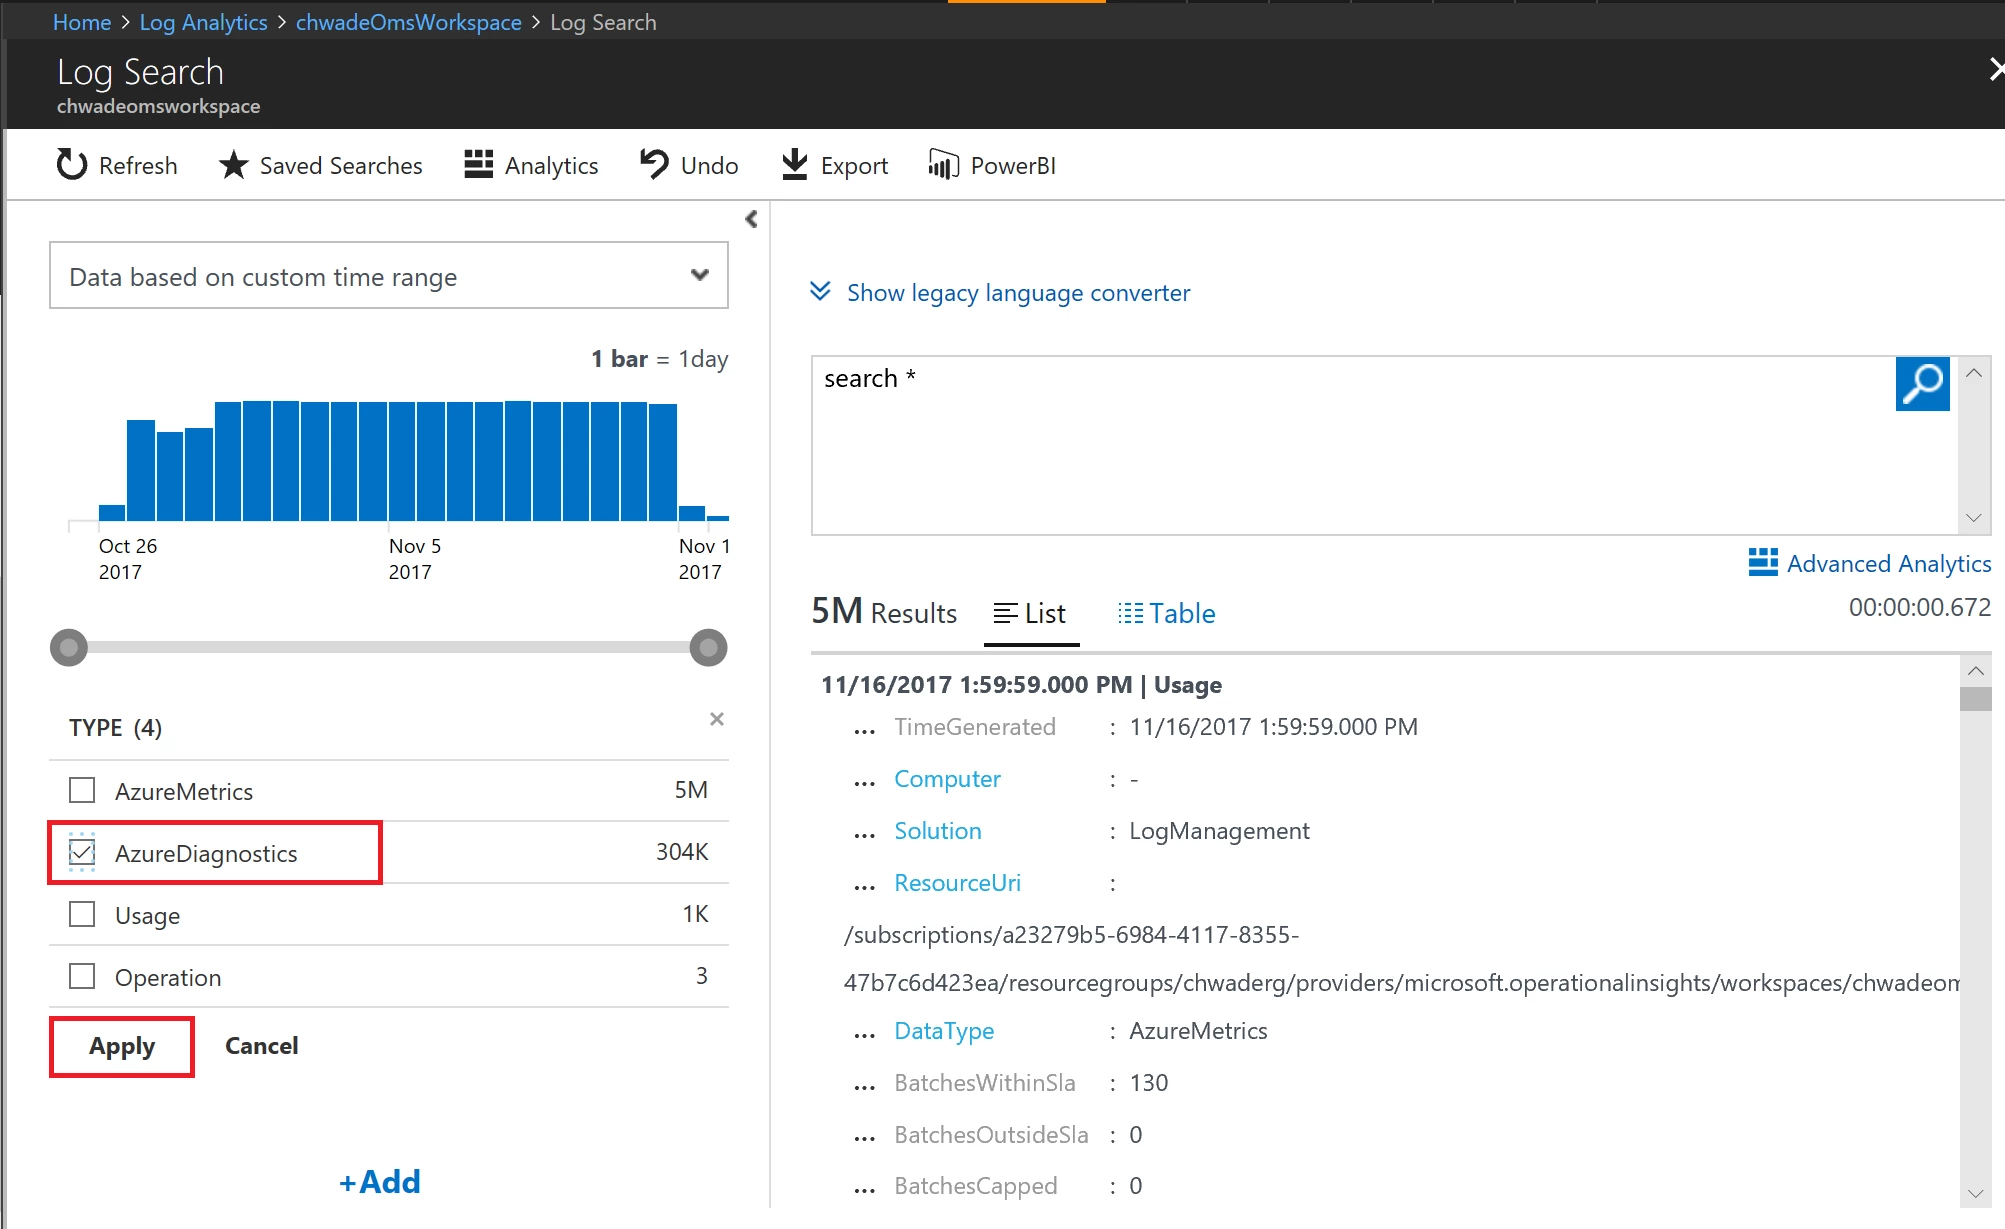
Notice that a Log Analytics query is being constructed on the fly. The EventClass_s field contains xEvent names, which may look familiar if you have used xEvents on premises. Click EventClass_s or one of the event names and Log Analytics will continue constructing a query based on interaction in the user interface. Log Analytics has the ability to save searches for later reuse.
This post describes only the tip of the iceberg regarding consuming Log Analytics data. For example, Operations Management Suite provides a website with enhanced query, dashboarding, and alerting capabilities on Log Analytics data.
Search query sample
The following sample query returns queries submitted to Azure Analysis Services that took over 5 minutes (300,000 miliseconds) to complete. The generic xEvent columns are normally stored as strings and therefore end with the “_s” suffix. In order to filter on the queries that took over 5 minutes, it is necessary to cast Duration_s to a numeric value. This can be achieved using the toint() syntax.
search * | where ( Type == “AzureDiagnostics” ) | where ( EventClass_s == “QUERY_END” ) | where toint(Duration_s) > 300000
Query scale out
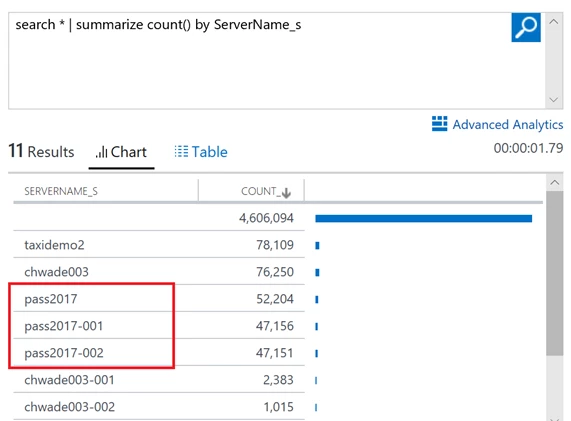
When using scale out, you can identify read-only replicas because the ServerName_s field values have the replica instance number appended to the name. The resource field contains the Azure resource name, which matches the server name that the users see. Additionally, the IsQueryScaleoutReadonlyInstance_s field equals true for replicas.
Consume diagnostic logs in Power BI
The feature that probably unlocks Log Analytics data for most BI professionals is the Power BI button. Simply click to download a text file that contains an M expression, which can be pasted into a blank query in Power BI Desktop. The expression contains the current Log Analytics query and consumes from the Log Analytics REST API.

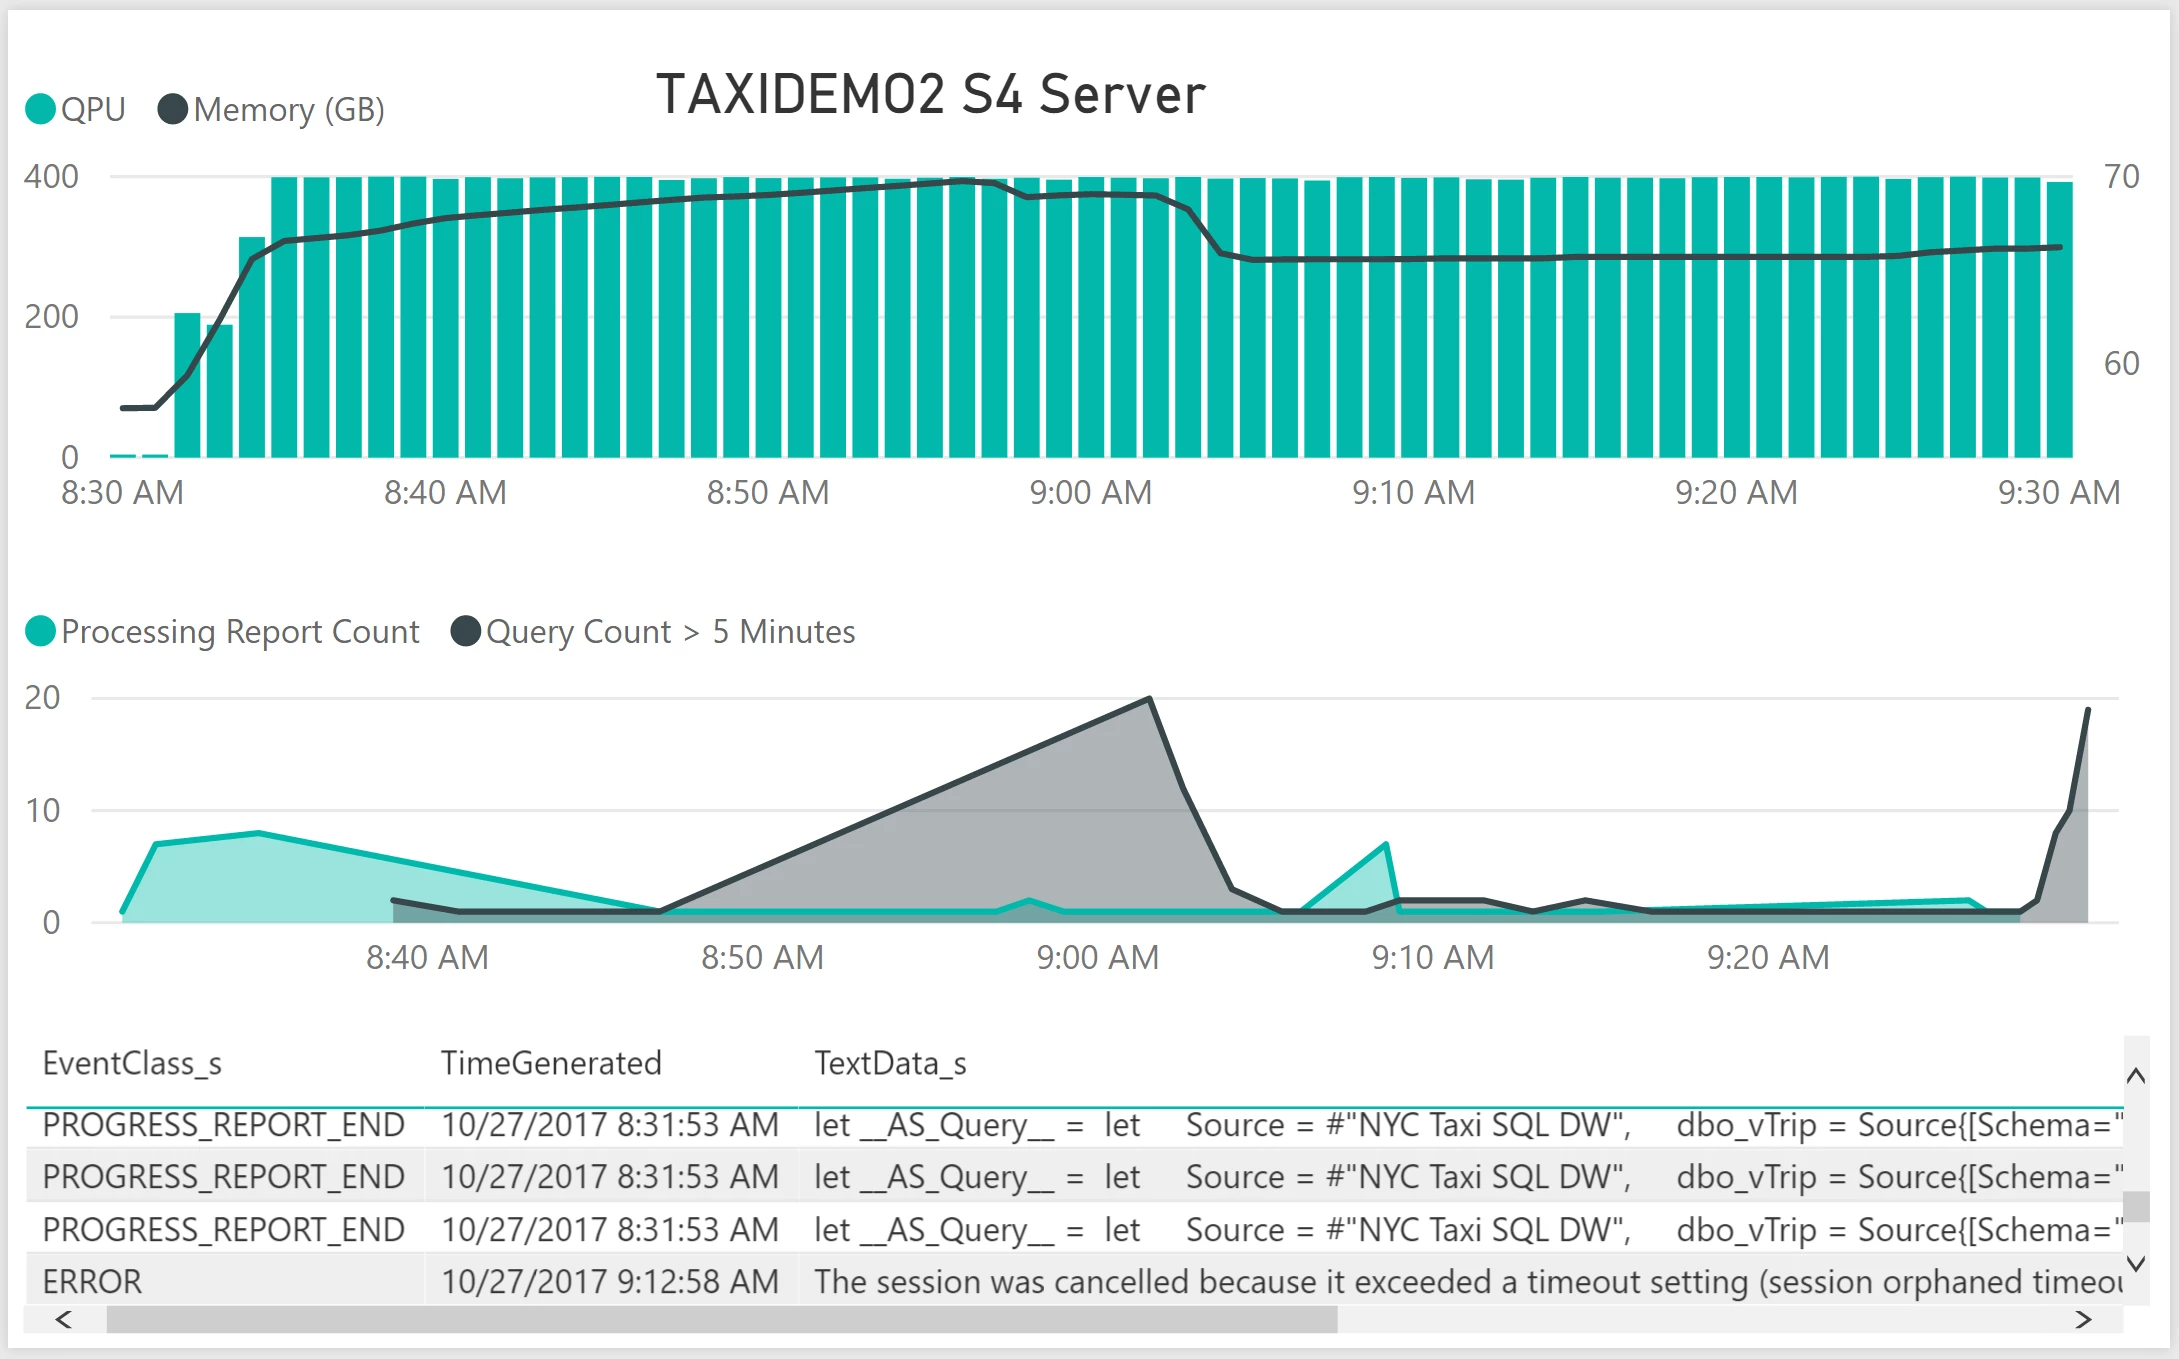
This enables a variety of analytical reports such as the following one, showing the information below.
- The S4 server is not hitting the 100 GB memory limit.
- During the time range, the QPU is maxed out. S4 servers are limited to 400 QPUs.
- Long running queries were taking place during processing/data refresh operations.
- Users received timeout errors due to contention between long running queries and processing operations.
- The server may be a good candidate for query scale out.
We hope you’ll agree that Azure Analysis Services integration with Azure Monitor Resource Diagnostic Logs provides a rich capability for auditing and monitoring, side-by-side analysis of xEvent data with other data such as metrics data, and is easier to set up than xEvents on premises. Enjoy!