Now you can continuously monitor any Analytics query computed from your telemetry in Visual Studio Application Insights, and display the results on an Azure shared dashboard. This means that when you put together a dashboard to help you monitor the performance or usage of your web services, you can include quite complex analysis alongside the other metrics.
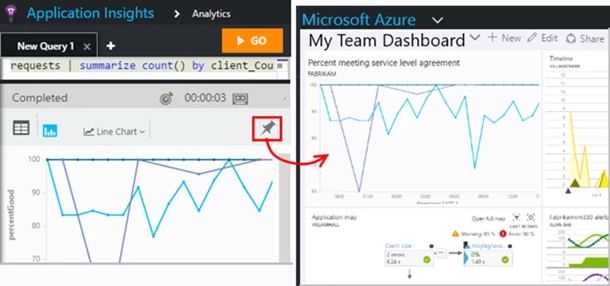
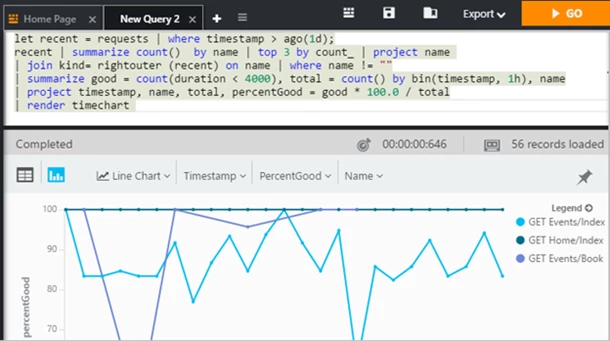
As an example, let’s suppose you’d like to track what percentage of requests your website completes within two seconds. You’re only interested in the most popular pages. This is not difficult to write as an Analytics query, but it certainly isn’t offered as one of the standard metrics. Until recently, you could only run the query in the Analytics window, and you’d have to click Go at intervals to keep the chart up to date. But now you can include it in a comprehensive dashboard of your system telemetry.
Dashboards are great for bringing together your most important charts (as you’ve probably already discovered), especially if you want to see metrics from multiple apps in your system at the same time. Furthermore, you can create multiple dashboards. The dev team room can keep an eye on performance of all the front and backend apps, while management can do a weekly review of system usage.
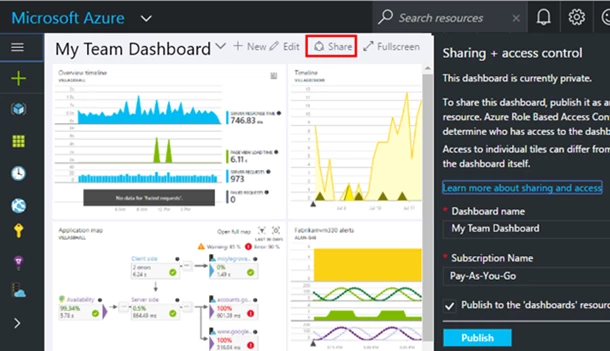
1. Share a dashboard
You can only pin Analytics charts to a shared dashboard, so sharing at least one dashboard is an important preliminary step:
2. Write an Analytics query
Now open the Application Insights resource for your app.
Then click through to Analytics:

Write and test your query. Let’s take the example we mentioned earlier:
3. Pin it to the dashboard
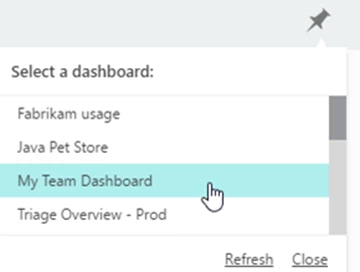
Click the pin icon and choose a dashboard. Only the shared dashboards in your subscription will appear in the list. You might need to upgrade your account to turn on this feature.
4. Adjust the chart on the dashboard
Now go back to the dashboard in the Azure portal. You can adjust the position and title of the chart in the usual way.
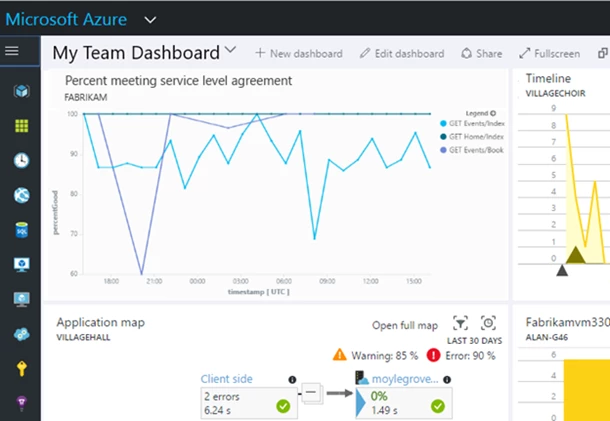
The chart is refreshed by re-running the query about every half hour.
Automatic grouping
When you pin a chart to a dashboard, you get a slightly simplified display in some cases.
For example, here’s a chart in Analytics in which we’ve summarized by country:
requests | summarize count_search = count() by client_CountryOrRegion
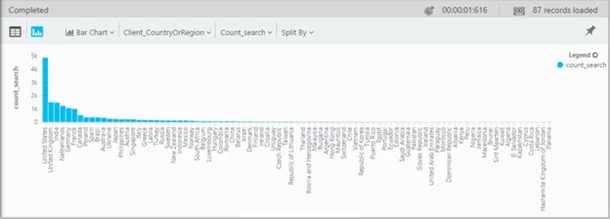
But when we pin it to the dashboard, it looks like this:
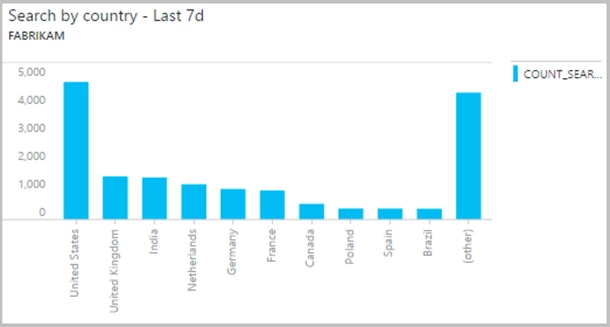
Notice how the long tail has been grouped into “(other)”? If you pin a bar chart of a count of values separated into discrete bins on the Y-axis, then the smaller items are automatically grouped.
What’s next?
This is only the first step in operationalizing your insights by adding them to the Azure dashboard. We still have other capabilities to deliver, including supporting pie chart visualization, editing dashboard charts, and other small settings that will help you set your dashboard parts exactly the way you want them.
As always, feel free to send us your questions or feedback by using one of the following channels: