Once you adopt Azure Site Recovery, monitoring of your setup can become a very involved exercise. You’ll need to ensure that the replication for all protected instances continue and that virtual machines are always ready for failover. While Azure Site Recovery solves this need by providing point-in-time health status, active health alerts, and the latest 72 hour trends, it still needs several man hours to keep track and analyze these signals. The problem is aggravated when the number of protected instances grow. It often needs a team of disaster recovery operators to do this for hundreds of virtual machines.
We have heard through multiple feedback forums that customers receive too many alerts. Even with these alerts, long-term corrective actions were difficult to identify as there is no single pane to look at historical data. Customers have reached out to us with a need to track various metrics such as recovery point objective (RPO) health over time, data change rate (churn) of machine disks over time, current state of the virtual machine, and test failover status as some of the basic requirements. It is also important for customers to be notified for alerts as per your enterprise’s business continuity and disaster recovery compliance needs.
The integrated solution with logs in Azure Monitor and Log Analytics
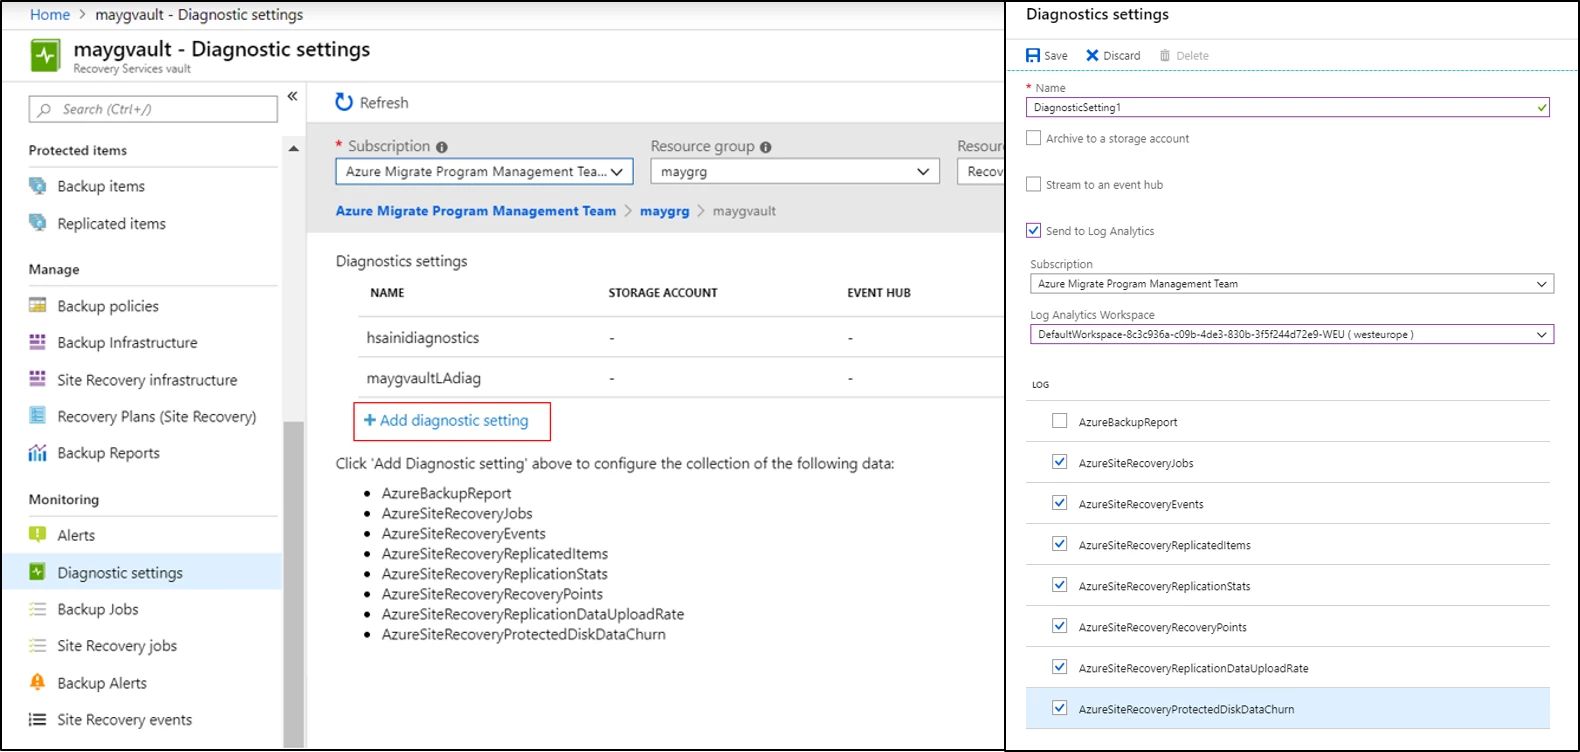
Azure Site Recovery brings to you an integrated solution for monitoring and advanced alerting powered by logs in Azure Monitor. You can now send the diagnostic logs from the Site Recovery vault to a workspace in Log Analytics. The logs are, also known as Azure Monitor logs, visible in the Create diagnostic setting blade as of today.
The logs are generated for Azure Virtual Machines, as well as any VMware or physical machines protected by Azure Site Recovery.

Once the data starts feeding in the workspace, the logs can be queried using Kusto Query Language to produce historical trends, point-in-time snapshots, as well as disaster recovery admin level and executive level dashboards for a consolidated view. The data can be fed into a workspace from multiple Site Recovery vaults. Below are a few example use cases that can be currently solved with this integration:
- Snapshot of replication health of all protected instances in a pie chart
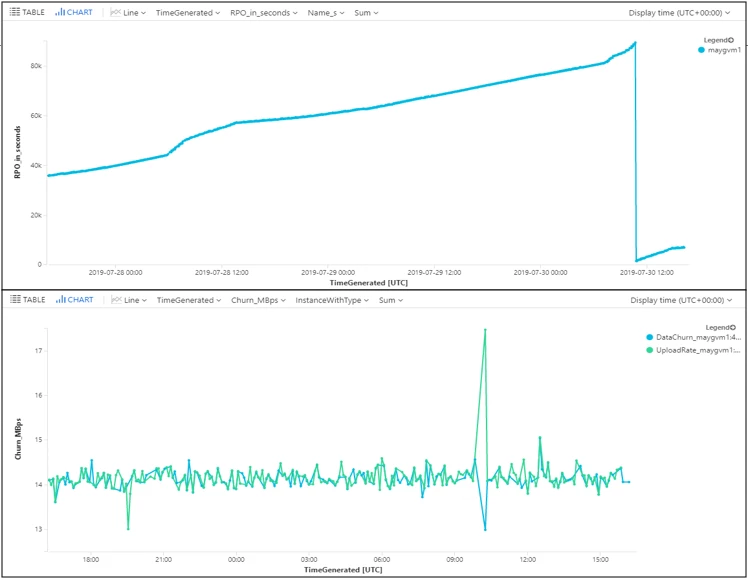
- Trend of RPO of a protected instance over time
- Trend of data change rate of all disks of a protected instance over time
- Snapshot of test failover status of all protected instances in a pie chart
- Summarized view as shown in the Replicated Items blade
- Alert if status of more than 50 protected instances turns critical
- Alert if RPO exceeds beyond 30 minutes for more than 50 protected instances
- Alert if the last disaster recovery drill was conducted more than 90 days ago
- Alert if a particular type of Site Recovery job fails
Sample use cases

These are just some examples to begin with. Dig deeper into the capability with many more such examples captured in the documentation “Monitor Site Recovery with Azure Monitor Logs.” Dashboard solutions can also be built on this data to fully customize the way you monitor your disaster recovery setup. Below is a sample dashboard:

Azure natively provides you the high availability and reliability for your mission-critical workloads, and you can choose to improve your protection and meet compliance requirements using the disaster recovery provided by Azure Site Recovery. Getting started with Azure Site Recovery is easy, check out pricing information and sign up for a free Microsoft Azure trial. You can also visit the Azure Site Recovery forum on MSDN for additional information and to engage with other customers.
