We are excited to announce a set of new features allowing you to gain deeper insights on the operations of your Azure resources and consume this data in flexible ways. We are also excited to announce the great work done by one of our partners, Splunk, to help you view and analyze Azure diagnostics data.
Archive and stream Azure Audit Logs
Azure Audit Logs is a data source that provides a wealth of information on the operations on your Azure resources. The most important data within Azure Audit Logs is the operational logs from all your resources. This includes all control-plane operations of your resources tracked by Azure Resource Manager. For example, this includes logs such as creation of VMs, starting websites, dropping database, success and failure of deployments. By default, everything in Azure Audit logs is available for 90 days. You provided feedback to have the ability to archive this data for much longer, for static analysis of the historical data for as well as for compliance auditing.
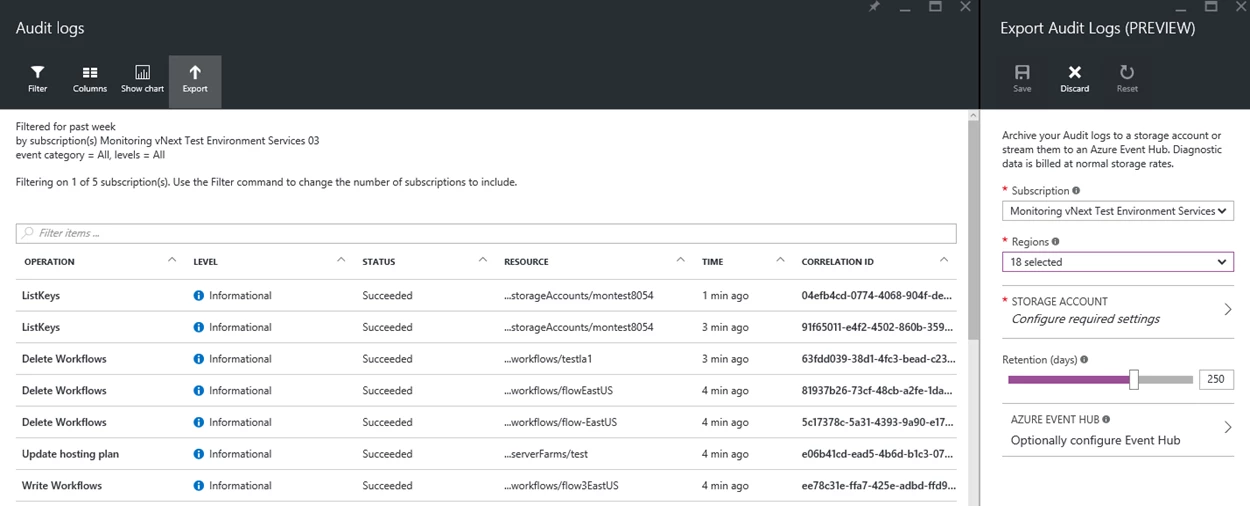
We are excited to announce you can now route all operational logs to your Blob storage and stream it to your Event Hub.

You can select a subscription followed by the resource regions where you want the data to be included from and select any storage account within that subscription to route this data to. You can easily configure the retention period for audit logs for each subscription. These configurations get saved as your Log Profile for that subscription. You can select additional subscriptions and configure similar profile for each of them and route them to a storage account.
In the near future, we will include the ability to configure and manage multiple log profiles from within the Portal, and also the ability to do this at a resource-group level.
You also have the ability to stream the log profile to your Azure Event Hub. Azure Event Hub is a highly scalable publish-subscribe service that can ingest millions of events per second and stream them into multiple applications. This lets you process and analyze the massive amounts of data produced by your connected devices and applications. Once Event Hub has collected the data, you can transform and pipe it to any real-time analytics provider or with batching/storage adapters.
This unlocks a lot of scenarios including the ability to integrate directly with Azure Stream Analytics, Azure HD Insight, Machine Learning, Elastic Search/ELK and many more. You could filter and route diagnostics data directly to Power BI for building sharable dashboards.
You can also configure archival and streaming for Audit Logs using Azure Insights PowerShell and Azure CLI.
Stream Azure diagnostics data for VMs and Cloud Services to Event Hub
We've received feedback that cloud developer teams are looking for a much faster, lower latency access to their hot path diagnostics metrics and logs, and they need more flexibility to leverage this data in custom dashboards and tools for depth analytics.
We are excited to announce that Azure developers can now stream Azure Diagnostics counters and events within seconds to your Azure Event Hub. This includes ETW events, Performance Counters, Windows Event Logs and Application Logs.
As mentioned above, integration with Azure Event Hub unlocks the ability to analyze and process Azure Diagnostics data using various Azure services such as Azure Stream Analytics, Azure HD Insights or Elastic Search/ELK or your own custom solutions. You could use Azure Stream Analytics to configure advanced alerts to monitor your VMs, Cloud Services or Web Apps.
Learn more about Azure Diagnostics and Event Hub in our documentation article.
Manage and download diagnostics logs
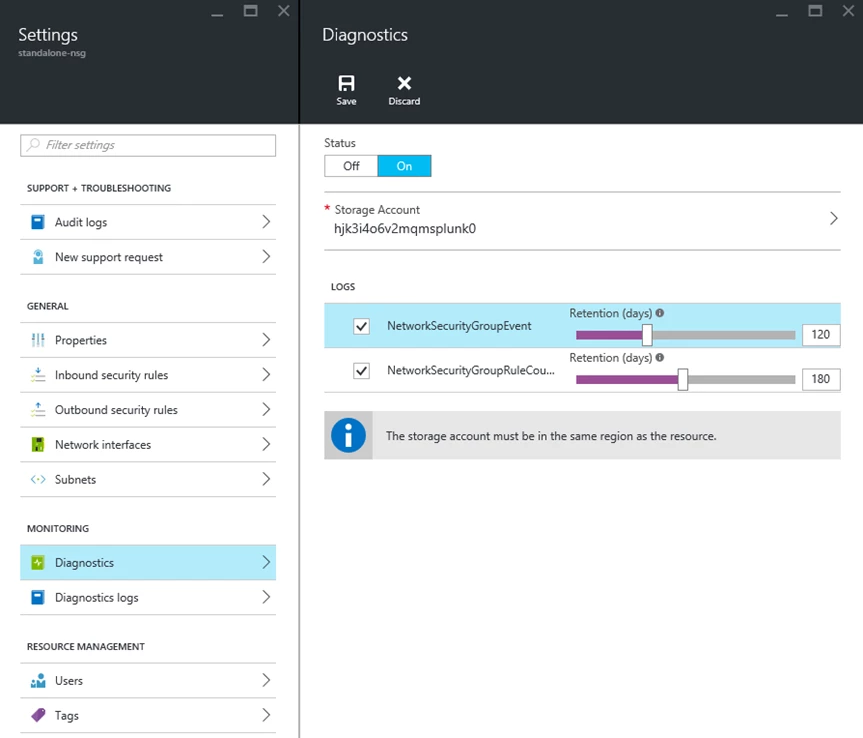
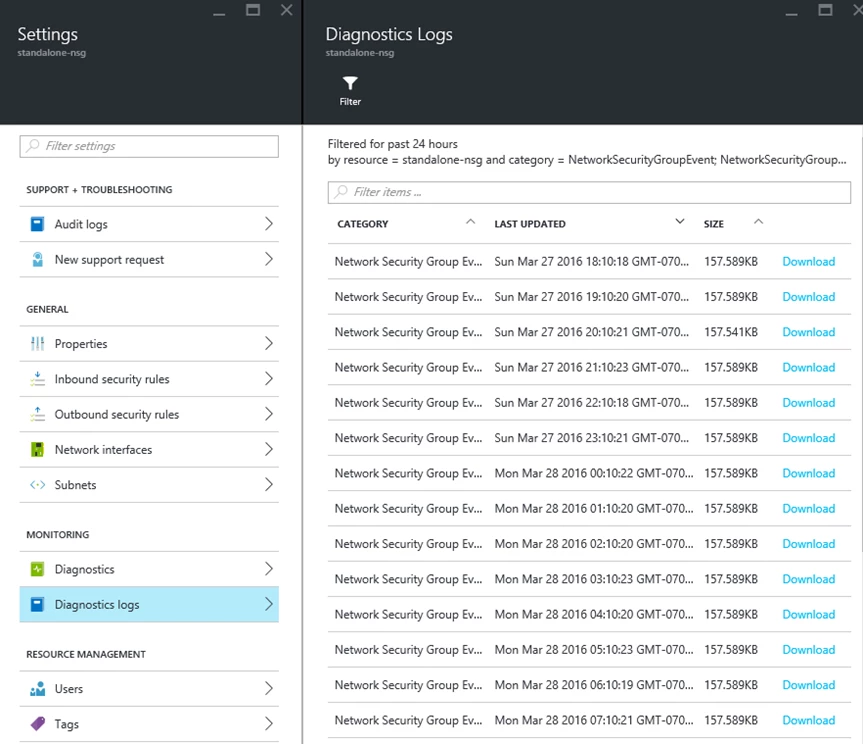
In addition to diagnostics logs from VMs, Cloud Services and websites, various Azure services now provide detailed diagnostics data. This includes services such as Network Security Group logs, Software Load Balancer logs and Application Gateway logs. You can opt-in to route these logs to your Blob storage account. This will be available in JSON format, as hourly blobs. You can also control data retention for each log type.

Once the logging has been turned on, the diagnostic logs start flowing in to your storage account. You can easily browse and download the latest log files for quick troubleshooting or analysis.

You can also configure diagnostics for the same using Azure Insights PowerShell and Azure CLI.
This ability to route platform logs with retention is now available for Azure services such as Azure Network Security Groups, Software Load Balancers, Application Gateways, Key Vault, Azure Search and Azure Logic Apps.
Splunk add-on for Azure with support for audit logs
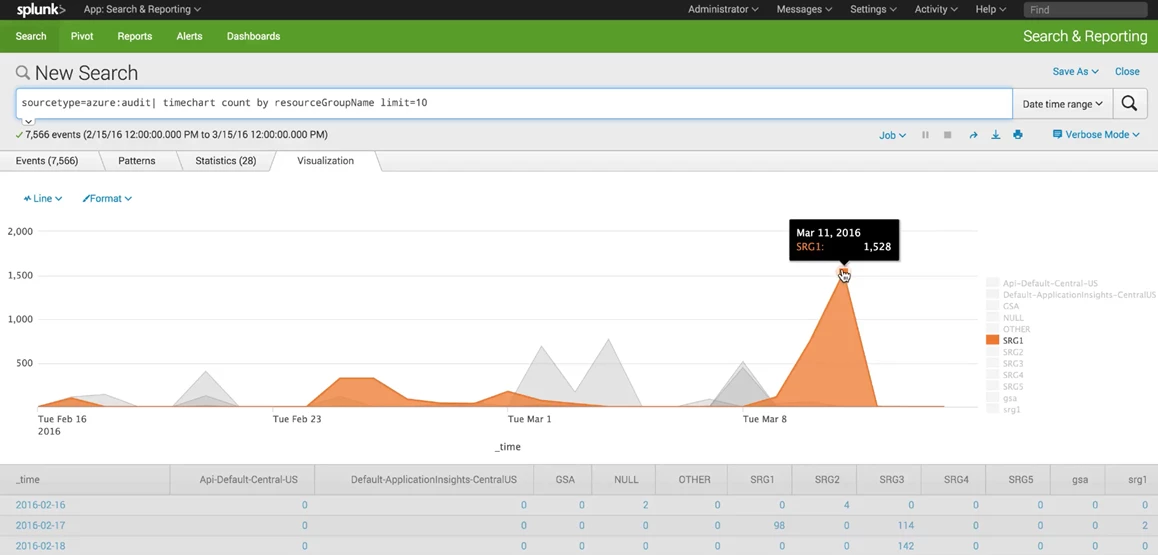
The Splunk Add-on for Microsoft Azure collects valuable diagnostic, performance, and audit data for your infrastructure and websites running in Microsoft Azure. This week the Splunk team enhanced this Add-On with support for Azure Audit Logs.
Performance and diagnostic information is collected from Azure Storage Tables and Azure Storage Blobs. Audit Logs are collected from the Azure Insights Events API. Several prebuilt panels are included with this add-on. Check out the “Documentation” tab for more information.

Check out the quick video below highlighting the new audit log integration and visualization this Add-On supports.
Here is a blog post on getting started with Splunk on Azure.
Wrapping up
On the Azure monitoring team, we will continue to focus on providing you unprecedented access to diagnostics data from your resources. We want to empower you more by enabling flexible options to consume and analyze the data via Microsoft and partner services. With these new features, you have the ability to gain deeper insights on the operations on key Azure services.
Over time, more Azure Services will provide you access to detailed diagnostics logs. You will also see a lot of enhancements in the Azure Portal for these features soon. Please check out these new features and share your feedback.
