This is the second blog post in a four-part series on Monitoring on Azure HDInsight. “Monitoring on Azure HDInsight Part 1: An Overview” discusses the three main monitoring categories: cluster health and availability, resource utilization and performance, and job status and logs. This blog covers the first of those topics, cluster health and availability, in more depth.
As a high-availability service, Azure HDInsight ensures that you can spend time focused on your workloads, not worrying about the availability of your cluster. To accomplish this, HDInsight clusters are equipped with two head nodes, two gateway nodes, and three ZooKeeper nodes, making sure there is no single point of failure for your cluster. Nevertheless, Azure HDInsight offers multiple ways to comprehensively monitor the status of your clusters’ nodes and the components that run on them. HDInsight clusters include both Apache Ambari, which provides health information at a glance and predefined alerts, as well as Azure Monitor logs integration, which allows the querying of metrics and logs as well as configurable alerts.
Apache Ambari
Apache Ambari, included on all HDInsight clusters, simplifies cluster management and monitoring cluster via an easy-to-use web UI and REST API. Today, Ambari is the best way to monitor the health and availability of a single HDInsight cluster in depth.
Dashboard
The Ambari dashboard contains widgets that show a handful of metrics to give you a quick overview of your HDInsight cluster’s health. These widgets show metrics such as the number of live DataNodes (worker nodes), JournalNodes (ZooKeeper nodes), NameNode (head nodes) uptime, as well as metrics specific to certain cluster types such as YARN ResourceManager uptime for Spark and Hadoop clusters.
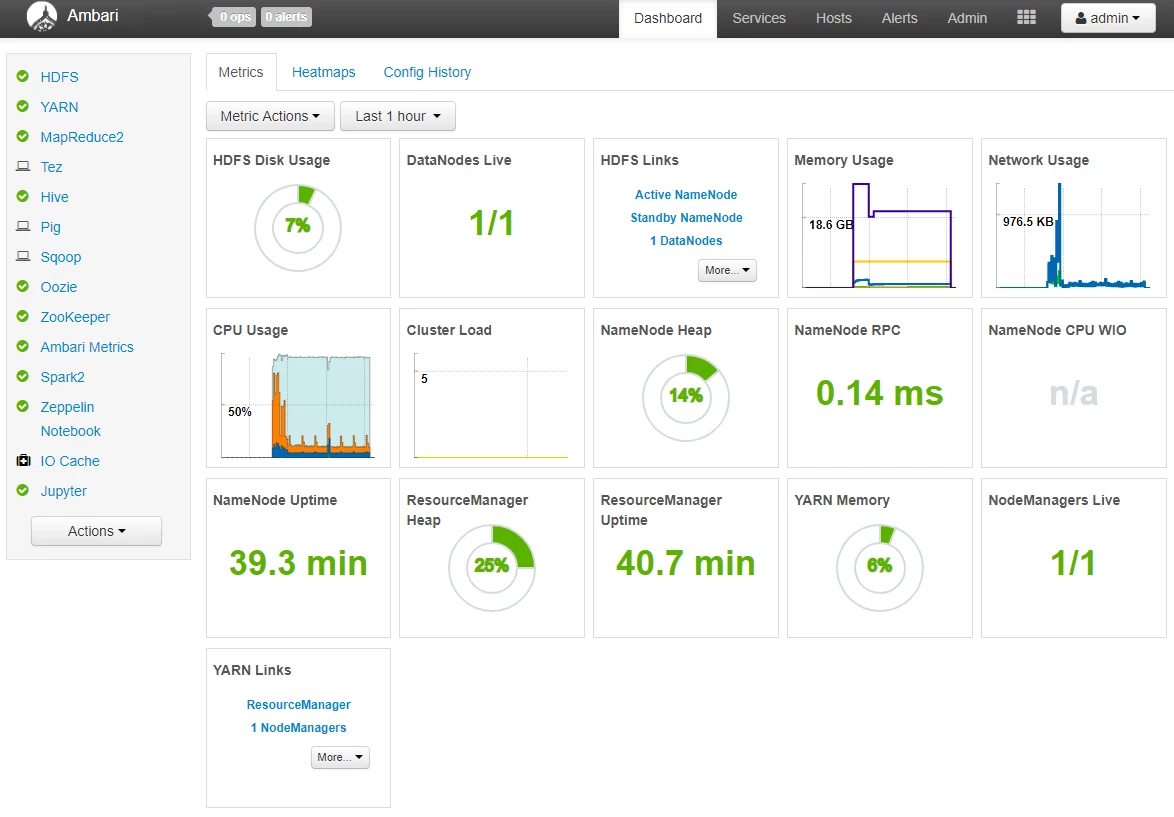
The Ambari Dashboard, included on all Azure HDInsight clusters.
Hosts – View individual node status
The hosts tab allows you to drill down further and view status information for individual nodes in the cluster. This offers a view showing whether there are any active alerts for the current node as well as the status/availability of each individual component running on the node.
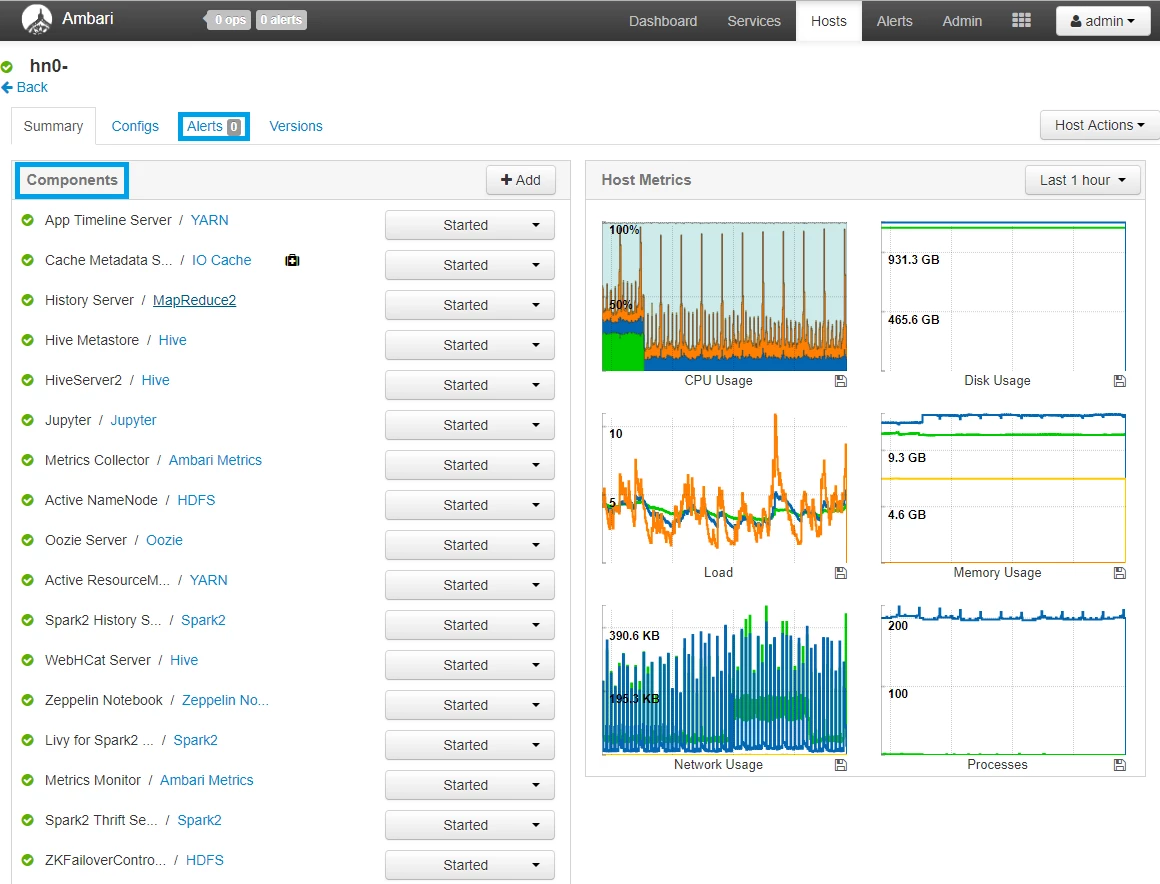
The Ambari Hosts view shows detailed status information for individual nodes in your cluster.
Ambari alerts
Ambari also provides several configurable alerts out of the box that can provide notification of specific events. The number of currently active alerts is shown in the upper-left corner of Ambari in a red badge containing the number of alerts.

Ambari offers many predefined alerts related to availability, including:
|
Alert Name |
Description |
|
DataNode Health Summary |
This service-level alert is triggered if there are unhealthy DataNodes. |
|
NameNode High Availability Health |
This service-level alert is triggered if either the Active NameNode or Standby NameNode are not running. |
|
Percent JournalNodes Available |
This alert is triggered if the number of down JournalNodes in the cluster is greater than the configured critical threshold. It aggregates the results of JournalNode process checks. |
|
Percent DataNodes Available |
This alert is triggered if the number of down DataNodes in the cluster is greater than the configured critical threshold. It aggregates the results of DataNode process checks. |
A full list of Ambari alerts that help monitor the availability of a cluster can be found in our documentation, “Availability and reliability of Apache Hadoop cluster in HDInsight.”
The detailed view for each alert shows a description of the alert, the specific criteria or thresholds that will trigger a warning or critical alert, and the check interval for the criteria. The thresholds and check interval can be configured for individual alerts.
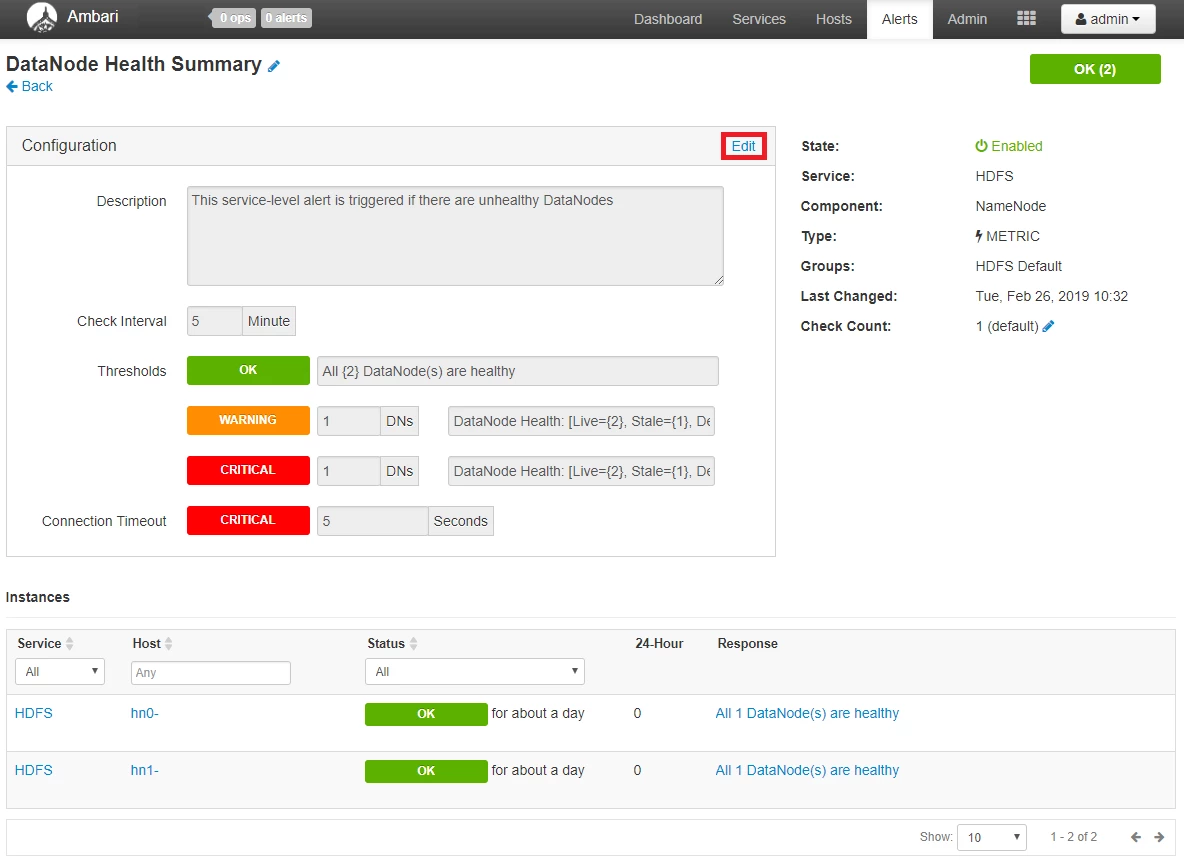
The Ambari detailed alert view shows the description of the alert and the check interval and threshold for the alert to fire.
Email Notifications
Ambari also offers support for configuring email notifications. Ambari email notifications can be a good way to monitor alerts when managing many HDInsight clusters.

Configuring Ambari email notifications can be a useful way to be notified of alerts for your clusters.
Azure Monitor logs integration
Azure Monitor logs enables data generated by multiple resources such as HDInsight clusters, to be collected and aggregated in one place to achieve a unified monitoring experience.
As a prerequisite, you will need a Log Analytics Workspace to store the collected data. If you have not already created one, you can follow the instructions for creating a Log Analytics Workspace.
You can then easily configure an HDInsight cluster to send many workload-specific metrics to Log Analytics, such as YARN ResourceManager information for Spark/Hadoop clusters, broker topics, and controller metrics for Kafka clusters. You can even configure multiple HDInsight clusters to send metrics to the same Log Analytics Workspace so you can monitor all of your clusters in a single place. See how to enable Azure Monitor logs integration on your HDInsight cluster by visiting our documentation on using Azure Monitor logs to monitor HDInsight clusters.
Query metrics tables in the logs blade
Once Log Analytics Integration is enabled, which may take a few minutes, you can start querying the logs/metrics tables.
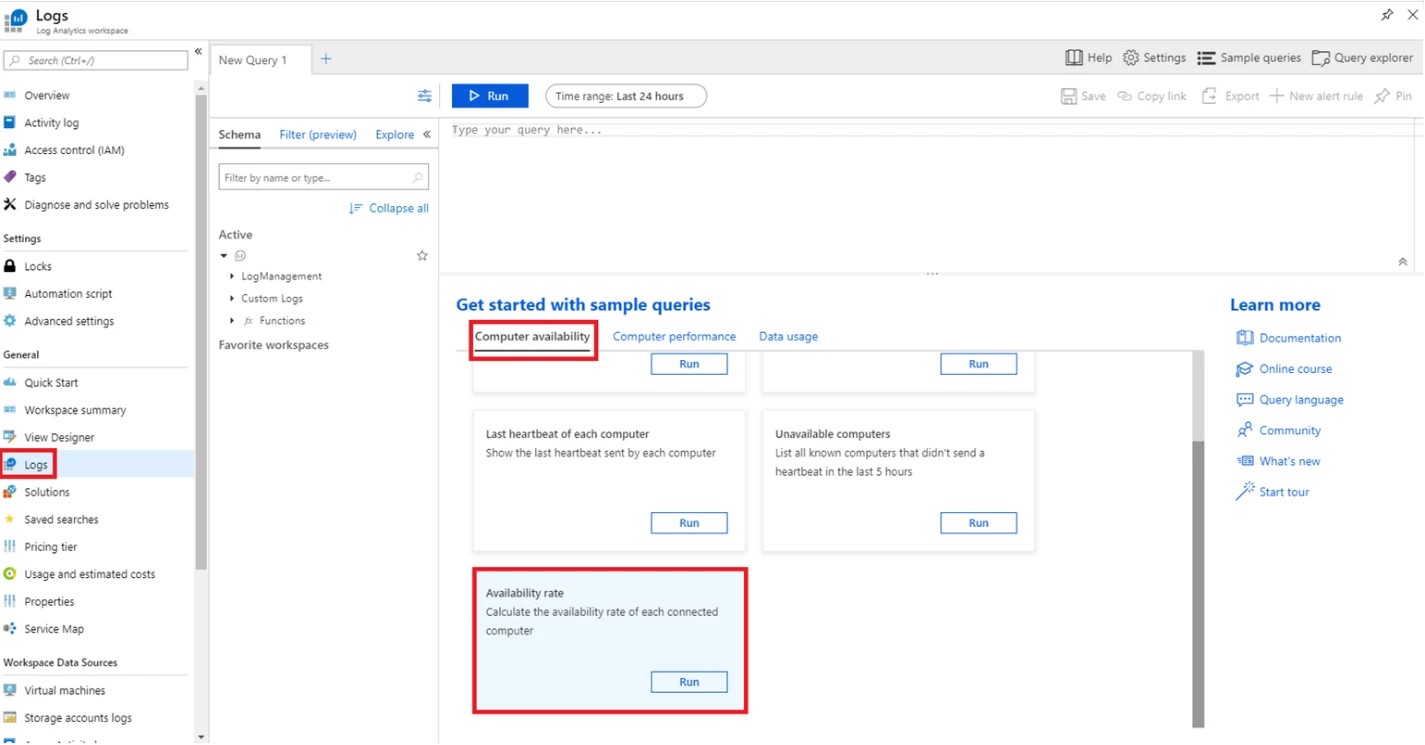
The Logs blade in a Log Analytics workspace lets you query collected metrics and logs across many clusters.
The computer availability tab in the logs blade of your Log Analytics Workspace lists a number of sample queries related to availability, such as:
|
Query Name |
Description |
|
Computers availability today |
Chart the number of computers sending logs, each hour. |
|
List heartbeats |
List all computer heartbeats from the last hour. |
|
Last heartbeat of each computer |
Show the last heartbeat sent by each computer. |
|
Unavailable computers |
List all known computers that didn’t send a heartbeat in the last 5 hours. |
|
Availability rate |
Calculate the availability rate of each connected computer. |
Azure Monitor alerts
You can also set up Azure Monitor alerts that will trigger when the value of a metric or the results of a query meet certain conditions.
You can condition on a query returning a record with a value that is greater than or less than some thresholds, or even on the number of results returned by a query. For example, you could create an alert to send an email when one or more nodes haven’t sent a heartbeat in one hour (i.e. is presumed to be unavailable). You can create multiple conditions that need to be met in order for an alert to fire.
There are several types of actions you can choose to trigger when your alert fires, such as an email, SMS, push, voice, an Azure Function, a LogicApp, a Webhook, an ITSM, or an Automation Runbook. You can set multiple actions for a single alert. Find more information about these different types of actions by visiting our documentation, “Create and manage action groups in the Azure portal.”
Finally, you can specify a severity for the alert in addition to the name. The ability to specify severity is a powerful tool that can be used when creating multiple alerts. For example, you could create one alert to raise a Warning (Sev 1) alert if a single head node becomes unavailable and another alert that raises a Critical (Sev 0) alert in the unlikely event that both head nodes go down. Alerts can be grouped by severity when viewed later.
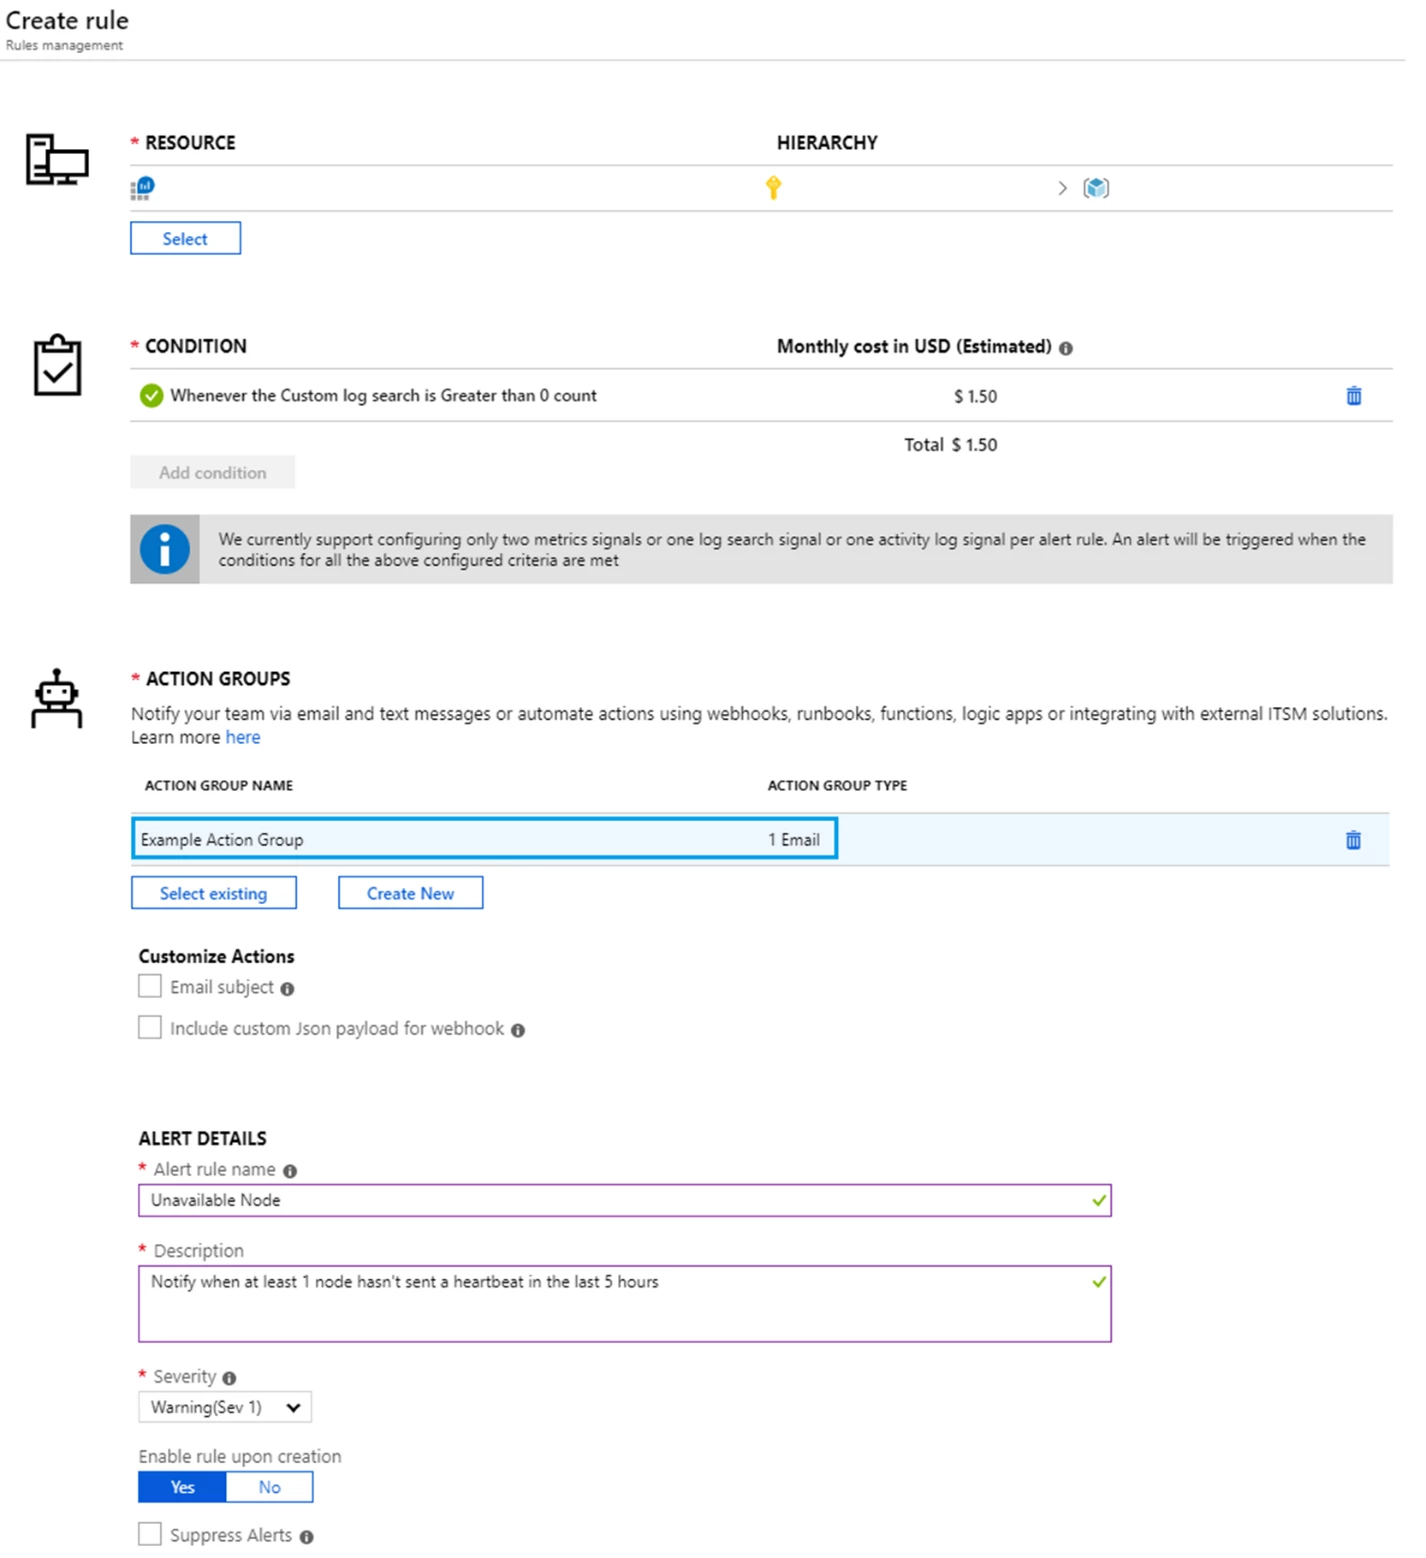
Azure Monitor alerts are an extremely customizable way to receive alerts for specific events.
Next steps
While HDInsight’s redundant architecture, designed for high availability, means that a single failure will never impact the functionality of your cluster, HDInsight makes sure that you are always informed about potential availability issues so they can be mitigated early on. Between Apache Ambari with Azure Monitor logs integration, and Apache Ambari with Azure Log Analytics integration, Azure HDInight will offer comprehensive solutions for both monitoring a cluster in depth or monitoring many clusters at a glance. You can learn more and see concrete examples in our documentation, “How To Monitor Cluster Availability With Ambari and Azure Monitor Logs.”
Try HDInsight now
We hope you will take full advantage of monitoring on HDInsight and we are excited to see what you will build with Azure HDInsight. Read this developer guide and follow the quick start guide to learn more about implementing these pipelines and architectures on Azure HDInsight. Stay up-to-date on the latest Azure HDInsight news and features by following us on Twitter #AzureHDInsight and @AzureHDInsight. For questions and feedback, reach out to AskHDInsight@microsoft.com.
About HDInsight
Azure HDInsight is an easy, cost-effective, enterprise-grade service for open source analytics that enables customers to easily run popular open source frameworks including Apache Hadoop, Spark, Kafka, and others. The service is available in 36 public regions and Azure Government and National Clouds. Azure HDInsight powers mission-critical applications in a wide variety of sectors and enables a wide range of use cases including ETL, streaming, and interactive querying.
