We’ve recently made it much easier to monitor microservices and containerized applications using Azure Application Insights. A single Application Insights resource can be used for all the components of your application. The health of the services and the relationships between them are displayed on a single Application Map. You can trace individual operations through multiple services with automatic HTTP correlation. Metrics from Docker, and other containers, can be integrated and correlated with application telemetry.
Segmenting Application Insights data by role
Until now, Application Insights has assumed that you create one Application Insights resource, and instrumentation key, for each server component or microservice in your application. With a microservices application, a single application can be composed of many different services, and it can be very time consuming to create and maintain separate resources. It’s also difficult to correlate results between them.
To solve this problem, we have added the capability for you to segment data in Application Insights by the cloud_RoleName property that is attached to all telemetry. This allows you to send all the data from all your servers to a single Application Insights resource, and filter on cloud_RoleName to see performance and health information for individual microservices. The cloud_RoleName property is set by SDKs to represent the appropriate name for your microservice, container, or app name in Azure App Service.
In the Failures, Performance, and metrics explorer blades, you will see new Cloud role name properties in the filter menu:
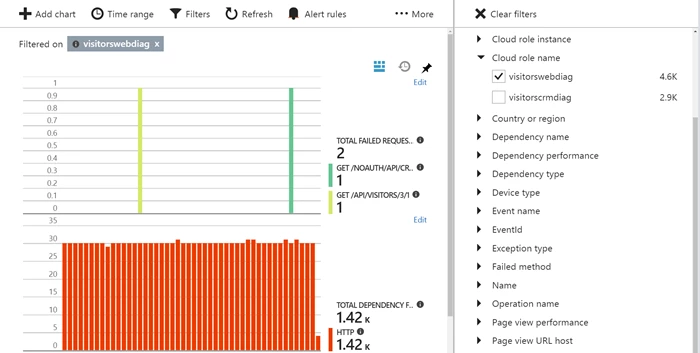
In the above example, we filtered the failures blade to show just the information for our front-end web service, filtering out failures from the CRM API backend.
We’ve also enabled a preview feature that allows the Application Map to segment server nodes by cloud_RoleName. To enable this capability, set Multi-role Application Map to On from the Previews blade.
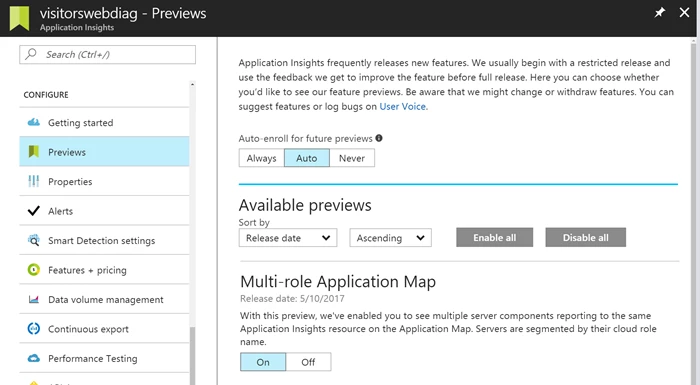
After enabling this preview, your map will show one server node for each unique value set in the cloud_RoleName field: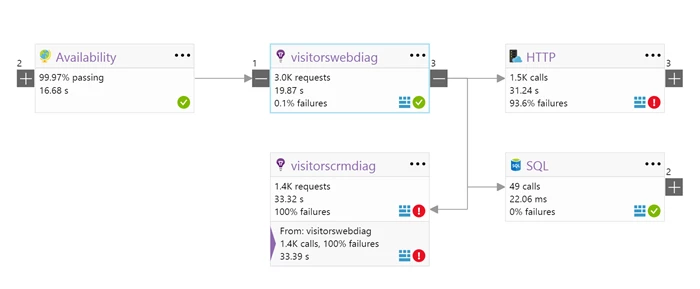
The calls between servers are tracked by using correlation Ids passed in the headers of HTTP requests, which we’ll talk about next.
Automatic HTTP correlation that works in containers
With the latest SDKs, 2.4.0-beta3 for ASP.NET and 2.1.0-beta3 for ASP.NET Core, we automatically correlate calls between services by injecting headers into the HTTP requests and responses. Previously this functionality required installing an instrumenting profiler, using the Application Insights Site Extension for App Services, or installing Status Monitor for other Azure Compute services. These extensions are difficult to provision in Service Fabric or Docker container environments.
This allows you to see all your microservices and containerized applications on the application map.
You can also see all the telemetry related to cross-server calls in a single view. For example, here is an exception from our visitors app sample:
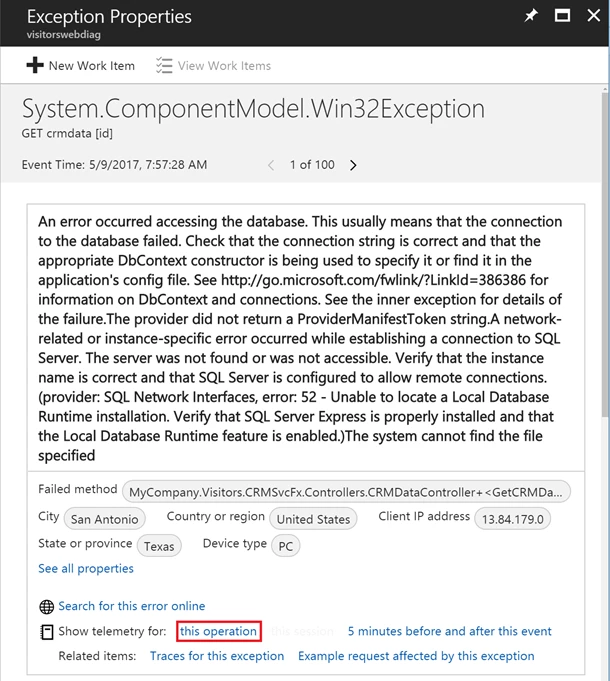
Click through to a correlated list of telemetry for this operation across the front-end web server and the back-end API:
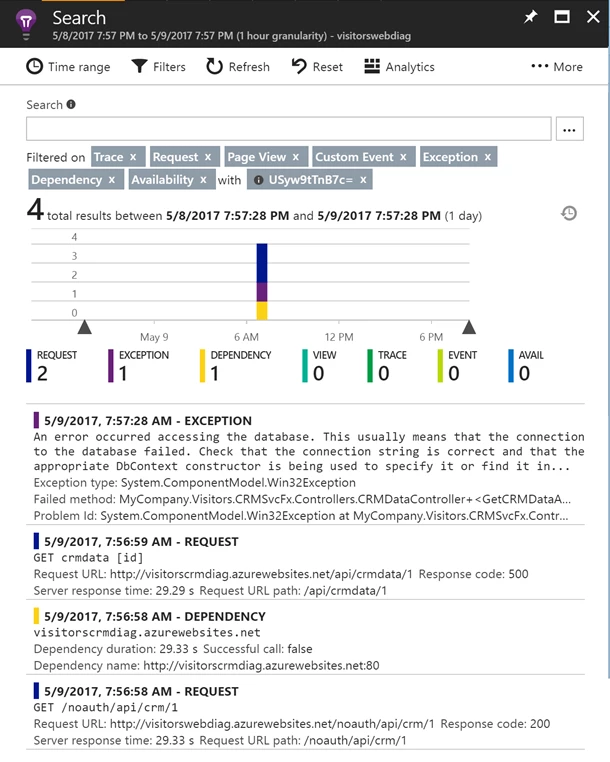
To take advantage of this capability, install the current pre-release versions of Application Insights SDKs available on NuGet.
SDK Support for .NET Core 2.0, Service Fabric, and Kubernetes
We have made improvements to our .NET SDKs so that the above features will work for .NET applications running in Service Fabric and Kubernetes. Our ASP.NET Core 2.1 SDK now supports both .NET Core 1.1 and .NET Core 2.0 Preview 1, including automatic request and dependency tracking capabilities. This allows you to get the full Application Insights experience with the latest versions of .NET Core.
If your application runs on Service Fabric, you can use our Service Fabric SDKs for Application Insights. Add the Microsoft.ApplicationInsights.ServiceFabric.Native NuGet package for Service Fabric reliable services and the Microsoft.ApplicationInsights.ServiceFabric package for guest executables and Docker containers.
Many Service Fabric applications use EventSource for high-scale logging. You can now log EventSource events to Application Insights by adding the Microsoft.ApplicationInsights.EventSourceListener package.
If your application runs in Docker on Kubernetes, you can use our Kubernetes SDK by adding the Microsoft.ApplicationInsights.Kubernetes package to your app.
Use NuGet package manager in Visual Studio to add the packages mentioned in this section. Check the “include previews” option to find the packages mentioned in this section.
Container metrics for Windows Docker Containers
It’s useful to see CPU, Memory, and other metrics about your individual Docker containers so that you can understand the health of your containers and achieve the right density of containers on physical machines. We have enriched our Windows Azure Diagnostics Extension (WAD) with support for collecting metrics from Docker containers running on Windows.
Once you have WAD installed, you can simply modify your diagnostics configuration file to collect Docker stats and send them to Application Insights.
Try it out today
We hope these new capabilities will allow you to have a great experience using Application Insights with microservices and containerized applications. Be sure to check out the docs, try out the SDKs and let us know how we can make Application Insights work better for you in these new environments.
In addition to the capabilities listed in this post, we’ve recently announced many other improvements to Application Insights that will help you find and fix issues in your applications.
As always, please share your ideas for new or improved features on the Application Insights UserVoice page. For any questions visit the Application Insights Forum.
