Today, we are excited to announce Azure SDK 2.5 for Visual Studio 2012, 2013 and 2015 Preview. We are also excited to announce Visual Studio 2015 Preview which adds even more Azure features. This post describes the features in these releases and the scenarios they enable.
Azure SDK 2.5 for .NET [download for VS 2013 | VS 2012 | VS 2015 Preview]
- Diagnostics improvements for Cloud Services and Virtual Machines: Diagnostics features now use the Azure extension model so you can turn on diagnostics or update the configuration without redeploy. New features include ETW for structured logging, crash dumps and Virtual Machines support for the first time.
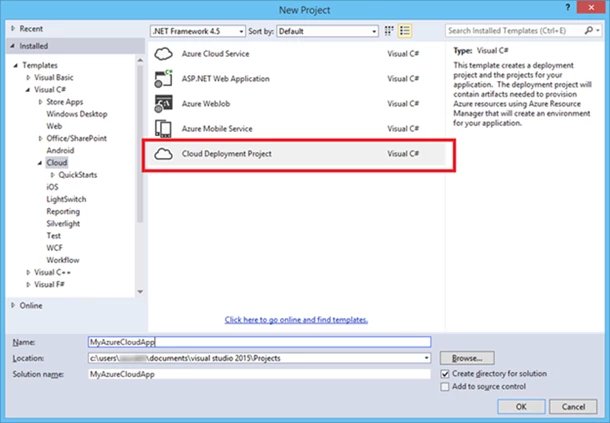
- Azure Resource Manager Tools: Create an application made up of multiple Azure resources using Azure Gallery templates. The experience is available with a new Cloud Deployment Project type that enables creating complex environments in a declarative and repeatable way by using JSON templates and parameter files.
- QuickStarts: The File > New Project > Cloud dialog includes new templates to demonstrate Microsoft Azure services.
- WebJobs remote debugging and Server Explorer support: We previously added the ability to publish WebJobs from Console or Web projects. This release adds Server Explorer support and remote debugging.
- Support for Blob folders in Storage Explorer: View and create folders in Blob Storage containers using Storage Explorer.
- HDInsight Server Explorer and Hive Query support: Write Hive queries and view Hive jobs, right from Visual Studio.
∙
Visual Studio 2015 Preview [download]
Azure SDK 2.5 is the first supported Azure SDK for the Visual Studio 2015 Preview. In addition to the Visual Studio 2013 features above, Visual Studio 2015 Preview introduces the following capabilities:
- Add Connected Services: Easily connect to services such as Azure Storage and Mobile Services. The flow adds appropriate project references, inserts connection strings and provides getting started guidance on consuming the services.
- Enterprise SSO: Configure enterprise single sign on (SSO) easily using Azure Active Directory.
- Connect Visual Studio to multiple Azure accounts: Your Visual Studio sign-in now automatically signs you into your Azure subscriptions. You can also sign in to additional Azure accounts to simultaneously access the Azure subscriptions and resources across all those accounts.
- Code Analysis for Azure: This NuGet package provides code analysis rules that identify coding patterns which cause performance, scalability or security problems with your Azure applications.
- ASP.NET 5.0: Publish to Azure has been updated with a Preview tab and performance improvements.
Diagnostics: Improved diagnostics logging with ETW
You can now perform structured and sematic logging using ETW Event Sources. ETW event sources and event IDs allow you to define logical events and stages of the application workflow. Track events across multiple tiers to help diagnose issues in your application workflow.
To enable logging of Event Sources, first define an event class in your source. The following snippet shows an EventSource for a sample guestbook application with two events:
[EventSource(Name="Contoso-GuestBook")]
public sealed class GuestBookEventSource: EventSource
{
    ...

    [Event(1, Message = "Added entry in table storage for guest '{1}'",
Level = EventLevel.Informational)]
    public void GuestBookEntryAdded (string guestName, Guid activityID )
    {
        if (this.IsEnabled()) {WriteEvent(1, guestName, activityID);}
    }

    [Event(2, Message = "Queued message to process blob '{0}'",
Level = EventLevel.Informational)]
    public void ThumbnailRequestPosted(string pictureUrl, Guid activityID)
    {
        if (this.IsEnabled()) { WriteEvent(2, pictureUrl, activityID);}
    }
    ...
}
After defining the event, log these in your application. For example, in our guestbook application, we log the GuestBookEntryAdded event:
GuestBookEventSource.Log.GuestBookEntryAdded(
    entry.GuestName, GuestBookEventSource.CurrentThreadActivityId);
Once you are logging the events in your code, configure diagnostics for your Role by right clicking on the Role and selecting Properties. On the Configuration property page make sure Enable Diagnostics is checked and click the Configure… button.
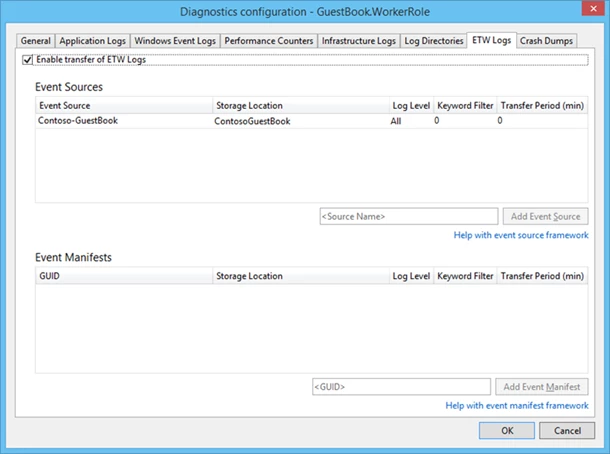
On the Diagnostics configuration dialog go to the ETW Logs tab and select Enable transfer of ETW logs. Add the appropriate event sources to transfer by specifying the event source name and clicking on the Add Event Source button. Once added, configure additional properties like the storage location for the logs, the log level, any keyword filters and transfer frequency.
Once you deploy your Cloud Service, you’ll get a high-level diagnostics overview. To view diagnostics data for a role, right click it and select View diagnostics data. This will display the diagnostics summary page with a new section for ETW Logs. Select the appropriate ETW log table to view corresponding errors.
Since the new diagnostics features use the extension model, you can update the diagnostic configuration for the running service after the cloud service is published. To do so, open Server Explorer and right click on the role and select Update Diagnostics.
Diagnostics: Configuring crash dumps
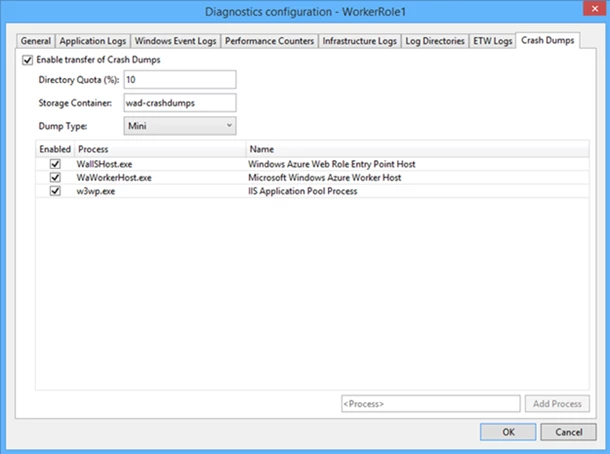
To configure crash dumps, go to the Crash Dumps tab on the Diagnostics Configuration dialog. Just add the name of the process for which you want to collect crash dumps, and diagnostics will collect these in a blob container of your choice. By default, the most common processes for cloud roles are pre-selected for crash dump collection.
Diagnostics: Virtual Machines
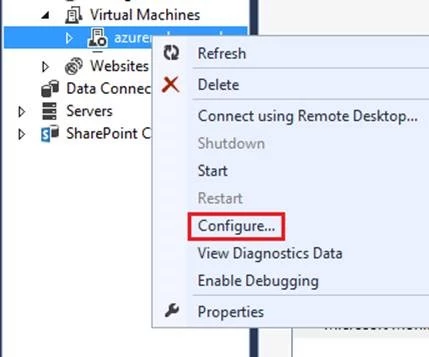
You can now collect diagnostics data from Virtual Machines to monitor your application or debug it through trace logs. To enable diagnostics, open Server Explorer (View > Server Explorer) and right-click on the virtual machine, then select Configure…
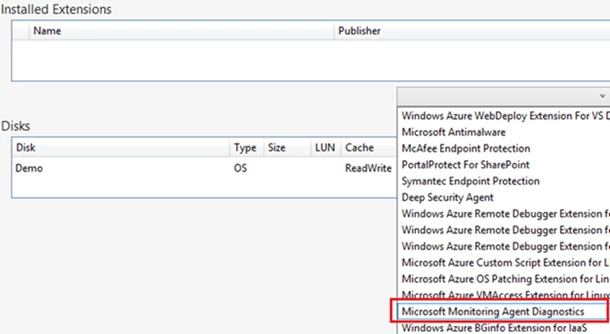
In the dialog that opens, you’ll see an Installed Extensions section. Click on the drop-down menu in this section, select the Microsoft Monitoring Agent Diagnostics extension and click Add.
This brings up the diagnostics configuration dialog. The settings are exactly the same as we saw in the PaaS scenarios. So you can develop your diagnostics code with ETW EventSource and set the diagnostics configuration in exactly the same way for IaaS VMs. When you finish configuring what you want to log, save your changes and update the configuration to apply your changes to the virtual machine.
One limitation of the diagnostics feature in the 2.5 release is that diagnostics logs are not captured when you debug your application locally in the Compute Emulator. You won’t get any performance counters, IIS logs or event logs. In addition, the logs will not be transferred to Azure storage or development storage for the local debug scenarios. To view application logs while debugging the application locally, use System.Diagnostics.Trace which can display traces in the Compute Emulator.
Azure Resource Manager Tooling
The Azure Resource Manager tooling allows you to quickly and efficiently create and deploy resources within resource groups for greater organization and repeatability. The tooling uses Azure Gallery templates which allow customization and parameterization, reducing costs when moving from one environment to the next. Get started by creating a deployment project from File->New Project-> Cloud-> Cloud Deployment Project.
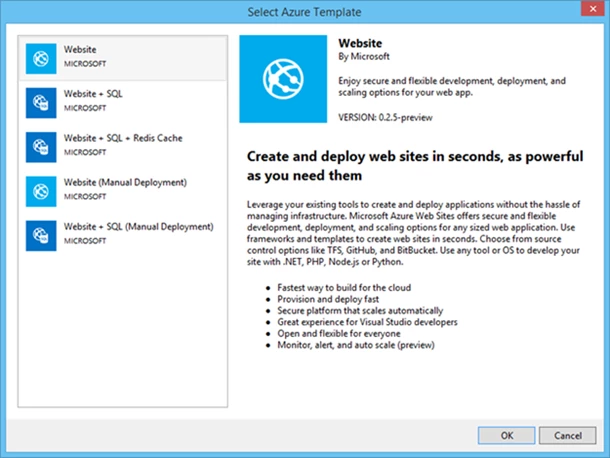
Once you create the project, you will find a list of common Azure Gallery templates. In future releases, more templates will be added for application scenarios that use other Azure features such as networking, storage, virtual machines. Select the template which is closest to the solution you are building.
Your Cloud App Solution
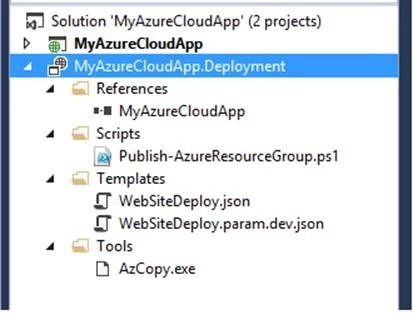
Select the Website template from the Azure Gallery to create a solution that contains the ASP.NET Website Project and a new project type – an Azure Resource Manager Deployment project called MyAzureCloudApp.Deployment. The Deployment project includes: a deployment template file (WebSiteDeploy.json), a template parameter definition (WebSiteDeploy.param.dev.json), and a PowerShell script (Publish-AzureResourceGroup.ps1) that can be used to deploy your resources to Azure.
The deployment template and parameter files make it easy to work in a cloud lifecycle pattern and treat these files as config as code. Notice a parameter file named *.dev.json is created by default – copying this parameter file and naming it *.test.json or *.staging.json allows for a single template to be used to build out multiple environments.
Visual Studio makes editing these JSON files easy with the built-in JSON editor and includes IntelliSense based on the published JSON schemas.
Create Azure Resources
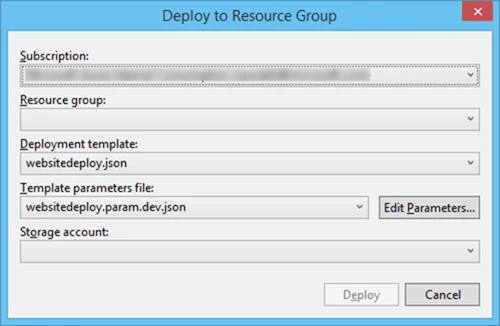
The simplest method to deploy your resources to Azure is to right click on the Deployment Project, and select Deploy > New Deployment…. This will bring up the Deploy to Resource Group dialog.
To create an Azure Resource Group which will contain all of the resources needed for the web application click on the Resource group combo box and select Create New to bring up the Create Resource Group dialog. Clicking the Create button on the Create Resource Group dialog will provision your Azure Resource Group but without any resources yet.
The Deployment template file (websitedeploy.json) and Template Parameter file (websitedeploy.param.dev.json) specify the details for deployment and provisioning or the resources. The storage account is used for uploading your application package to Azure Resource Manager so it can be included in the deployment of the template. If you don’t already have a storage account, you will need to create a storage account before continuing.
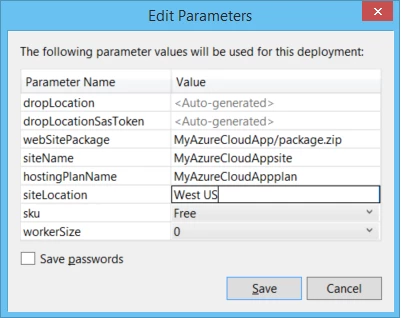
Clicking the Edit Parameters button will bring up a dialog that allows you to specify the website name, web hosting plan name and website location, etc.
The parameter values will be saved back to the WebSiteDeploy.param.dev.json file so the next time you want to deploy this website isn’t necessary to enter this information. Being able to customize and store the local JSON reduces the chance of errors when re-deploying the resources.
Once all the parameters have been specified and saved, click the Deploy button to have your application and resources deployed to Azure! You can see detailed progress in the Output window and can view the resource group and all the deployed resources ion the new and enhanced Azure Portal.
QuickStarts
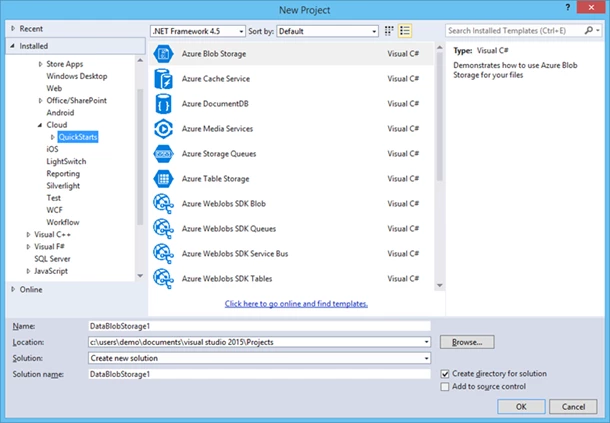
QuickStarts provides sample code which demonstrates how to leverage the Azure SDK and other libraries to interact with Azure Services. Find QuickStarts under File -> New Project -> Cloud -> QuickStarts.
In the current release, there are samples which demonstrate how to use Azure Storage (Blobs, Tables, Queues), DocumentDB, Azure Redis Cache Service, Azure Media Services, Azure WebJobs (Blob, Tables, Queues, Service Bus Queues) and Service Bus (Topics, Queues). There are also samples demonstrating how to use the Microsoft Azure Management Libraries (MAML) to programmatically create resources in Azure with C#.
WebJobs
Azure WebJobs and WebJobs SDK are now Generally Available. To learn more about WebJobs and the WebJobs SDK, get started with the Azure WebJobs Recommended Resources.
We previously added the ability to publish WebJobs from Console or Web projects. In this release, we add Server Explorer support, as well as remote debugging.
WebJobs SDK is preinstalled in WebJobs Templates
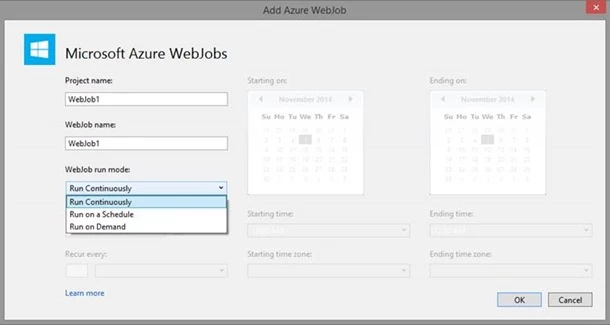
The WebJobs project templates now automatically include references to the WebJobs SDK. During project creation, you specify what type of WebJob is needed:
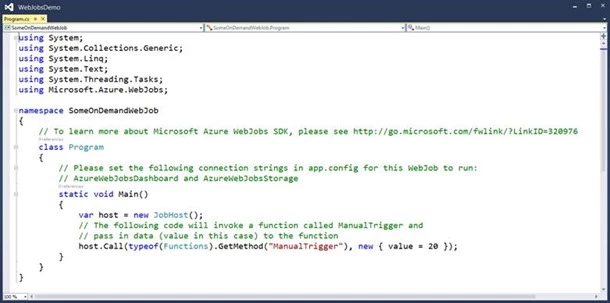
For on-demand and Scheduled jobs, the files dropped into the project are specific to scheduled or on-demand tasks. The Program.cs file of an on-demand or scheduled job contains code for executing the WebJob explicitly.
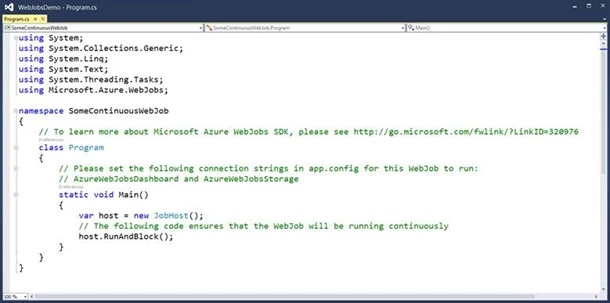
Continuous WebJobs get a different Program.cs file. The continuous template code includes a call to start the WebJob host and block it from exiting.
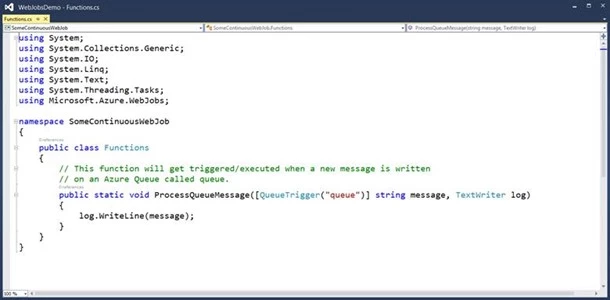
Likewise, the code in the Functions.cs file that is dropped into Continuous WebJob projects includes some of the WebJobs SDK-enabled attributes used for watching Azure Storage Queues.
WebJobs Server Explorer Features
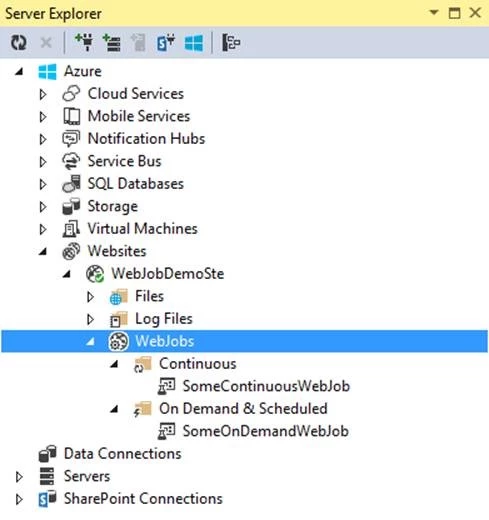
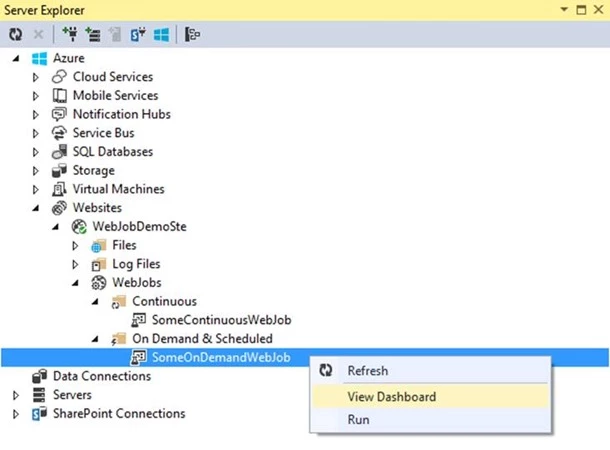
WebJobs appear under the corresponding Website in Server Explorer and are grouped according to their run mode.
Each WebJob Server Explorer node exposes context menu gestures for added functionality. Getting to a WebJob’s dashboard is as easy as a single menu-click. Developers can also elect to run on-demand or Scheduled WebJobs using the context menu gesture.
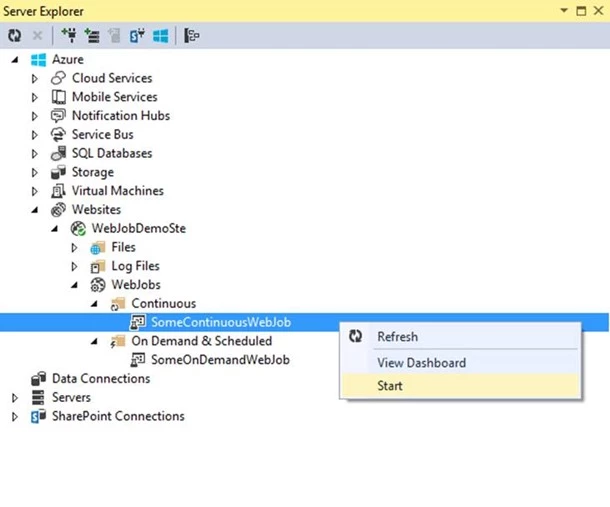
Continuous WebJob nodes also provide a one-click method of getting to an Azure WebJob’s dashboard. Continuous WebJobs can be started or stopped from the context menu, as well.
WebJobs Remote Debugging
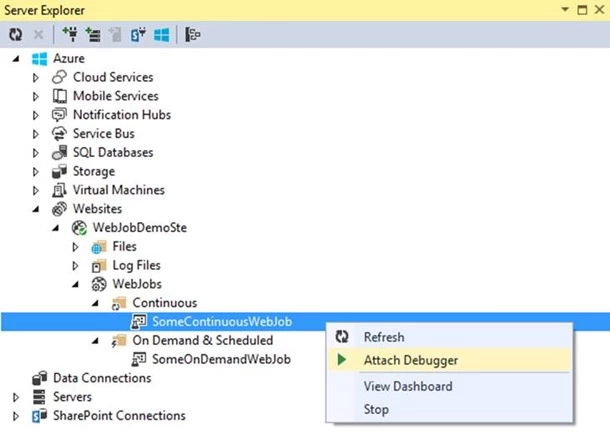
We’ve also added Remote Debugging support for continuous WebJobs. Once a Continuous WebJob has started, the Attach Debugger gesture is visible via the context menu of the Continuous WebJob’s node.
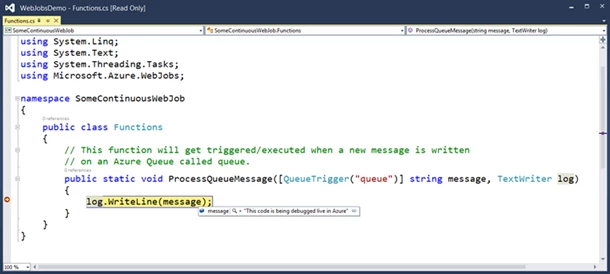
By placing a breakpoint in the code of a Continuous WebJob and attaching the debugger, the code can be stepped through and debugged as though it were running locally in Visual Studio.
Storage Explorer
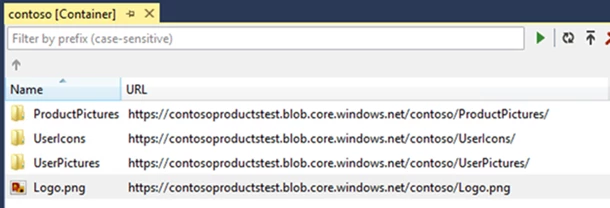
Blob folders allow you to easily segment groups of blobs into logical units – this is particularly useful if you’re using one blob container to store all your information. These blob folders are just a prefix for the blob name delimited with the / character. For example, if you have a file.png blob inside a pictures folder, the URL for that blob will be in the format https://.blob.core.windows.net//pictures/file.png
Starting with this release, you can see and navigate through folders in Azure blob containers from Visual Studio. Navigate through folders by double-clicking on a folder to go inside it, and using the up arrow to go up a level.
Additionally, you can create folders when uploading a blob to Azure Storage using the upload button.
HDInsight Server Explorer and Hive Query Support
Now the SDK includes tools in Server Explorer that make you more productive working with your Big Data using HDInsight’s hosted Hadoop services and using Hive to query your datasets.
Like any other Azure service, you can browse the HDInsight resources in your subscription and do common dev-test tasks. You can use the Server Explorer to easily browse your Hive tables, examine schemas, and even query the first 100 rows of a table. This helps you understand the shape of the data you are working with.
Also, there is tooling to create Hive queries and submit them as jobs. Use the context menu against a Hadoop cluster to immediately begin with “Write a Hive Query” for quick scripts. The Job Browser tool helps you visualize the job submissions and status. Double click on any job to get a summary and details in the Hive Job Summary window. In the example below, we query the table with geographic info to find the count of all countries and then sort by country.
Last, the backing blob storage used by HDInsight is listed in the explorer. You can navigate to any blob container and open it to work with files. The backing store is associated with the Hadoop cluster during cluster creation in the Azure dashboard. Management of the Hadoop cluster is still performed in the same Azure dashboard.
For more complex script development and lifecycle management you can create Hive projects within Visual Studio. In the new project dialog (see below) you will find a new HDInsight Template category. A helpful starting point is the Hive Sample project type. This project is pre-populated with a more complex Hive query and sample data for the case of processing web server logs.
Visual Studio 2015 Preview
Azure SDK 2.5 is the first supported Azure SDK for the Visual Studio 2015 Preview. In addition to the Visual Studio 2013 features above, Visual Studio 2015 Preview introduces the following capabilities.
Sign-in with multiple accounts
Sign into Visual Studio 2015 Preview with an account that is also associated with your Azure Subscription, and you will automatically be signed into Azure. Server Explorer will display your Azure resources. There is no longer the need to sign in twice with the same account!
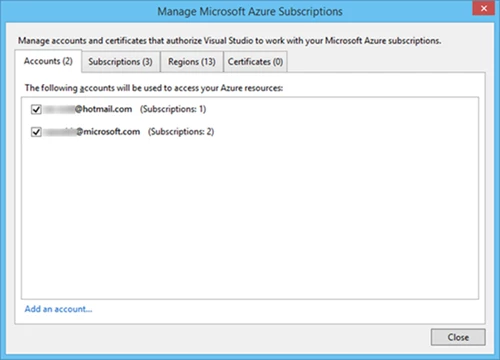
You can now also sign in simultaneously with multiple accounts. As an example, you can sign in with your Microsoft Account associated with an MSDN subscription and simultaneously sign in with your organization account for your company’s subscription. To sign in with another account, right click on the Azure node in Server Explorer and choose Manage Subscriptions. This will bring up the Manage Microsoft Azure Subscriptions dialog where you see all the Accounts that you have added to Visual Studio. To add a new account simply click on the Add an account link.
You can also uncheck accounts, subscriptions, regions or certificates in this dialog to filter the associated resources in Server Explorer.
Note: Another nice improvement to sign-in capabilities is the ability to view your SQL Databases in Server Explorer without the need to import a certificate. This particular feature is also available in Visual Studio 2013 Update 4. Simply sign into your Azure account and view your SQL Databases in Server Explorer.
Add Connected Services
The new Add Connected Service dialog in Visual Studio 2015 enables you to easily connect your application to Azure Storage, Azure Mobile Services, Office 365, and Salesforce. You can also set up Azure Active Directory single sign on.
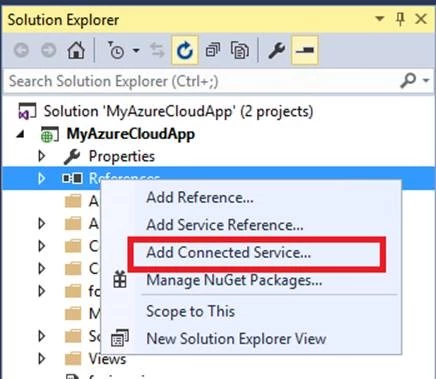
To add a connection to Azure Storage from an ASP.NET Web application, right click on the References node and select Add Connected Service…
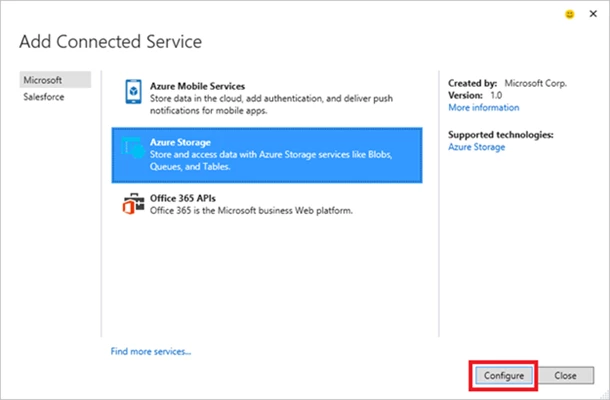
In the Add Connected Service dialog, select Azure Storage from the list of service providers and click Configure.
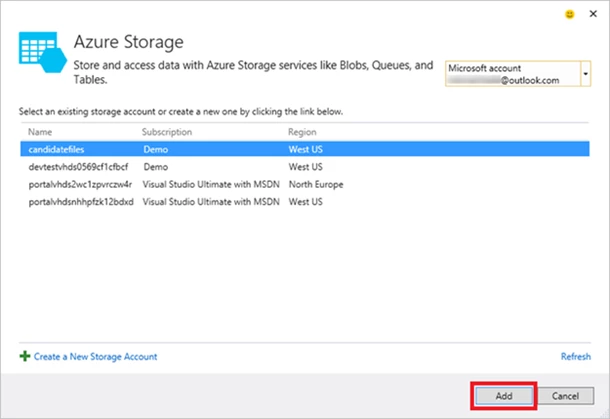
In the subsequent Azure Storage dialog, you will see a list of storage accounts available to you from your various subscriptions. Choose an existing storage account or provision a new one. After selecting an account, click Add to connect to that storage account from your application.
The dialog will add Azure Storage references using the latest Storage NuGet package and a connection string for your selected storage account in web.config. You then see a Getting Started page to illustrating next steps for using Azure Storage. Revisit the Getting Started page by right clicking on the GettingStarted.html file in Solution Explorer and choosing View in Browser.
Send us feedback by clicking on the Send a Smile icon in the Add Connected Services dialog. We’d love to hear any feedback.
Enterprise Single Sign On
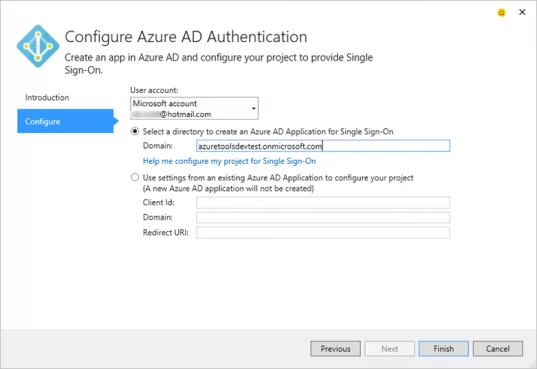
A common task for business application is to configure the application for enterprise single sign on using Azure Active Directory. You can now do this easily at any point during the construction of your application by right clicking on your application and selecting Configure Azure AD Authentication. This will bring up a wizard similar to the Add Connected Service experience to guide you through the process of configuring your application to work with Active Directory. Specifying an Active Directory Domain in the wizard will register your application with that Active Directory and configure your application to prompt for sign in. Registering your application in a domain is a great way to get started in a dev-test environment. You can easily reconfigure the application’s config files to use other domains as you move from one environment to the next in the application’s lifecycle. You can find out more about this feature in the Azure Active Directory Overview video.
Microsoft Code Analysis for Azure Preview
The .NET Compiler Platform in Visual Studio 2015 Preview provides new code analysis capabilities which detect code issues in real time as you write your code. Leveraging these capabilities, we have put together a small set of code analysis rules for Azure available through the Microsoft Code Analysis for Azure NuGet package. These rules identify issues in your code and when possible recommend automatic fixes.
To install the package, right click your solution and choose Manage NuGet Packages for Solution. Make sure Include Prerelease checkbox is checked and Search for Azure Code Analysis.
This should find the Microsoft.VisualStudio.Azure.CodeAnalysis package. Select projects in your solution and click Install to enable code analysis for those projects. Once an analyzer is added to the project, code analysis is always running. To run code analysis on the entire solution, build the solution. Any code analysis warnings or errors will automatically show up in the error list as you are make edits to a source file.
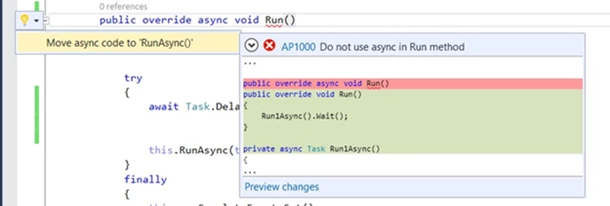
As you code, any line which has an issue will display a red (for errors) or green (for warning) underline. Hover over the underlined code to get more information. Click on the light bulb next to the issue to get additional details on fixes. For example, the screenshot below shows a code issue with the Run() method of a worker role being declared as async. This is a common scenario where you might want to perform some asynchronous operations in a worker role. However, declaring the Run() method itself as async will cause the role to restart in an infinite loop. We detect the issue and through the light bulb menu offer an automatic fix which will refactor the Run() method moving any async operations to another method.
Not all code issues have automatic fixes. If we can’t provide an automatic fix, the light bulb menu will point you to documentation describing how to fix the issue.
The code analysis rules provided in the NuGet package are just an initial set of rules designed to showcase the code analysis capabilities in the new .NET compiler. As we receive feedback, we will provide more rules and continue to iterate on the experience.
ASP.NET 5.0 Publish
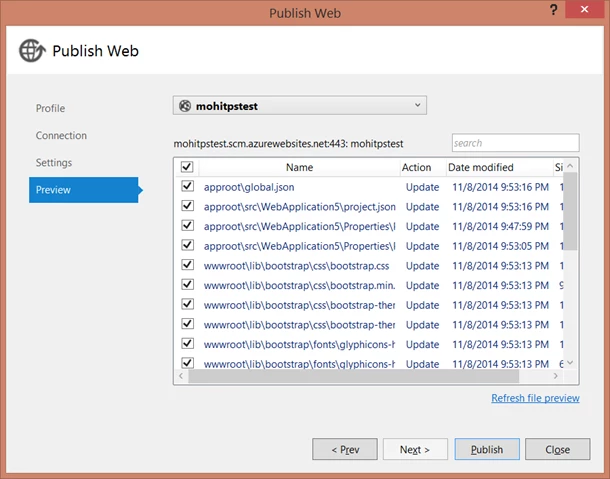
You can publish ASP.NET 5.0 (vNext) projects by right-clicking the project and selecting Publish. New in this release, the Preview tab is now enabled so you can see which files are about to be uploaded:
Summary
Azure SDK 2.5 and Visual Studio 2015 Preview make it easier than ever to get started developing rich cloud applications. Along with the Azure Developer Center’s growing set of .NET developer resources, today’s releases should make your development experience more enjoyable and efficient. Please make sure to see the Azure SDK 2.5 release notes for information about breaking changes from previous versions and known issues with the preview features.
If you don’t already have an Azure account, you can sign-up for a free trial and start using all of the above features today. You can then visit the Azure Developer Center to learn more about how to build apps with it. There are two ways to get started with the SDK:
- Install the SDK locally: Download for VS 2013 | VS 2012 | VS 2015 Preview
- VM Image in Azure: The fastest way to get started with Azure SDK 2.5 is by using the image either for Visual Studio 2015 Preview with Azure SDK 2.5 or Visual Studio Community 2013 with Azure SDK 2.5 from the Azure Virtual Machine gallery. Both of these images are available to all Azure customers. If you are a MSDN subscriber, you can also take advantages of additional Visual Studio 2013 images based on Windows 8.1 and Windows Server 2012 which have been updated to Visual Studio Update 4 and Azure SDK 2.5
Credits
This blog article is a collaboration of multiple people. Big thanks to Saurabh Bhatia and the Azure Cloud Tools team.

![clip_image004[1] clip_image004[1]](https://azure.microsoft.com/en-us/blog/wp-content/uploads/2014/11/clip_image0041_thumb.webp)
