Azure Log Analytics has recently been enhanced to work with a new query language. The query language itself actually isn’t new at all, and has been used extensively by Application Insights for some time. Recently, the language and the platform it operates on have been integrated into Log Analytics, which allows us to introduce a wealth of new capabilities, and a new portal designed for advanced analytics.
This post reviews some of the cool new features now supported. It’s just the tip of the iceberg though, and you're invited to also review the tutorials on our language site and our Log Analytics community space. The examples shown throughout the post can also be run in our Log Analytics playground – a free demo environment you can always use, no registration needed.
Pipe-away
Queries collect data, stored in one or more tables. Check out this basic query:
Event
This is as simple as you can get, but it's still a valid query, that simply returns everything in the Event table. Grabbing every record in a table usually means way too many results though. When analyzing data, a common first step is to review just a bunch of records from a table, and plan how to zoom in on relevant data. This is easily done with “take”:
Event

| take 10
This is the general structure of queries – multiple elements separated by pipes. The output of the first element (i.e the entire Event table) is the input of the next one. In this case, the final query output will be 10 records from the Event table. After reviewing them, we can decide how to make our query more specific. Often, we will use where to filter by a specific condition, such as this:
Event

| where EventLevelName == "Error"
This query will return all records in the table, where EventLevelName equals “Error” (case sensitive).
Looks like our query still returns a lot of records though. To make sense of all that data, we can use summarize. Summarize identifies groups of records by a common value, and can also apply aggregations to each group.
Event

| where EventLevelName == "Error"

| summarize count() by Computer
This example returns the number of Events records marked as Error, grouped by computer.
Try it out on our playground!
Search
Sometimes we need to search across all our data, instead of restricting the query to a specific table. For this type of query, use the “search” keyword:
search "212.92.108.214"

| where TimeGenerated > ago(1h)
The above example searches all records from the last hour, that contain a specific IP address.
Scanning all data could take a bit longer to run. To search for a term across a set of tables, scope the search this way:
search in (ConfigurationData, ApplicationInsights) "logon" or "login"
This example searches only the ConfigurationData and ApplicationInsights tables for records that contain the terms “logon” or “login”.
Note that search terms are by default case insensitive. Search queries have many variants, you can read more about them in our tabular operators.
Query-time custom fields
We often find that we want to calculate custom fields on the fly, and use them in our analysis. One way to do it is to assign our own name to automatically-created columns, such as ErrorsCount:
Event

| where EventLevelName == "Error"

| summarize ErrorsCount=count() by Computer

| sort by ErrorsCount
But adding fields does not require using summarize. The easiest way to do it is with extend:
Event

| where TimeGenerated > datetime(2017-09-16)

| where EventLevelName == "Error"

| extend PST_time = TimeGenerated-8h

| where PST_time between (datetime(2017-09-17T04:00:00) .. datetime(2017-09-18T04:00:00))
This example calculates PST_time which is based on TimeGenerated, but adapted from UTC to PST time zone. The query uses the new field to filter only records created between 2017-09-17 at 4 AM and 2017-09-18 at 4 AM, PST time.
A similar operator is project. Instead of adding the calculated field to the results set, project keeps only the projected fields. In this example, the results will have only four columns:
Event

| where EventLevelName == "Error"

| project TimeGenerated, Computer, EventID, RenderedDescription
Try it out on our playground.
A complementary operator is Project-away, which specifies columns to remove from the result set.
Joins
Join merges the records of two data sets by matching values of the specified columns. This allows richer analysis, that relies on the correlation between different data sources.
The following example joins records from two tables – Update and SecurityEvent:
Update

| where TimeGenerated > ago(1d)

| where Classification == "Security Updates" and UpdateState == "Needed"

| summarize missing_updates=makeset(Title) by Computer

| join (

SecurityEvent

| where TimeGenerated > ago(1h)

| summarize count() by Computer

) on Computer
Let’s review the two data sets being matched. The first data set is:
Update

| where TimeGenerated > ago(1d)

| where Classification == "Security Updates" and UpdateState == "Needed"

| summarize missing_updates=makeset(Title) by Computer
This takes Update records from the last day, that describe needed security updates. It then summarizes the set of required updates per computer.
The second data set is:
SecurityEvent

| where TimeGenerated > ago(1h)

| summarize count() by Computer
This counts how many of SecurityEvent records were created in the last hour per computer.
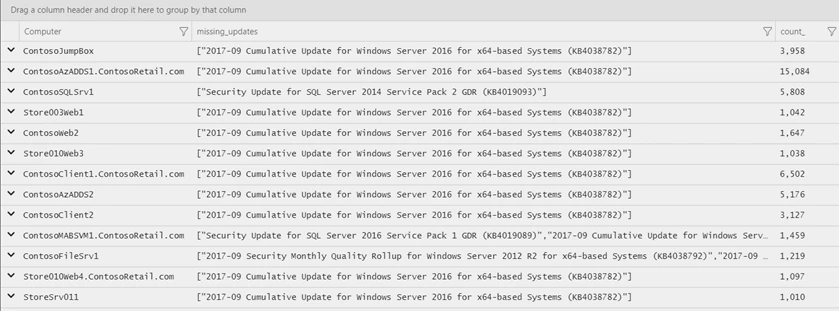
The common field we matched on is Computer, so eventually we get a list of computers that each has a list of missing security updates, and the total number of security events in the last hour.

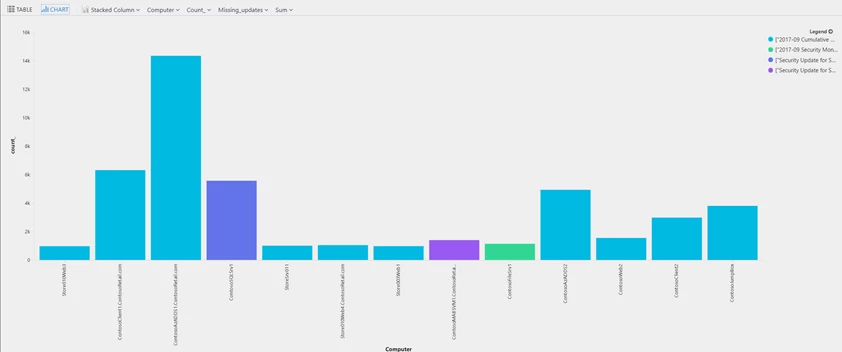
The default visualization for most queries is a table. To visualize the data graphically, add “| render barchart” at the end of the query, or select the Chart button shown above the results. The outcome can help us decide how to manage our next updates:

We can see that the most required update is 2017-09 Cumulative Update for Windows Server and that the 1st computer to handle should probably be ContosoAzADDS1.ContosoRetail.com.
Joins have many flavors – inner, outer, semi, etc. These flavors define how matching should be performed and what the output should be. To learn more on joins, review our joins tutorial.
Next steps
Learn more on how to analyze your data:
