This blog was co-authored by Xema Pathak, Senior Product Manager; Sahil Arora, Principal PM Lead; Matthew McCleary, Senior Program Manager and Brian Wren, Principal Content Developer.
Organizations are going through an era of digital transformation and are embracing various cloud-native technologies to fuel innovation. Developers are critical to this transformation; they need to quickly bring innovation to the market to address customer needs. At Microsoft Azure, we aspire to be the platform to empower you to accelerate your cloud-native journey!
Applications developed on Azure deliver reliability, scalability, and the ability to handle huge amounts of workloads anywhere around the world. These cloud-native apps take advantage of containers, serverless technology, and micro-services-based architecture with Azure Kubernetes Service, Azure Container Apps, and Azure Functions.
Such a growing application environment brings new challenges. Business acceleration is far more than just adopting cloud-native technologies, it’s also about agility and scale. We recognize how onerous it can be for developers to configure and monitor the infrastructure and distributed microservices. Once microservices are deployed, you need the ability to effectively detect and troubleshoot issues to ensure that you provide performance and reliability to your customers. Combating these challenges requires a reliable and scalable monitoring solution that seamlessly combines metrics, logs, and dashboards into a single experience.
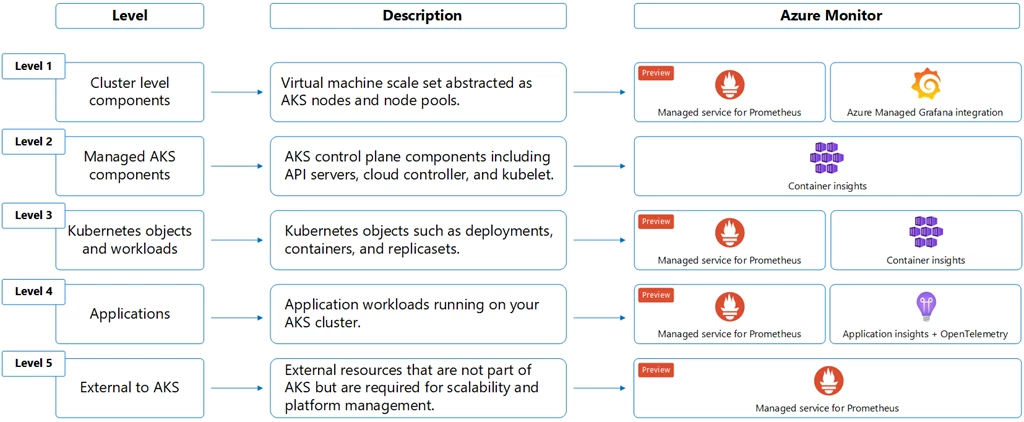
Our team has been busy bringing you a reliable, scalable, and secure monitoring service with Azure Monitor. We are excited to share our new offerings—Azure Monitor managed service for Prometheus (preview) and Azure Managed Grafana. They complement existing Azure Monitor tools to help you monitor each layer of your full cloud-native stack on Kubernetes and quickly troubleshoot issues across microservices and infrastructure. Additionally, you can now set up collection for Prometheus metrics and container logs and view them in Grafana dashboards with a single click!
The new Azure Monitor managed service for Prometheus (preview) gives you a fully managed cloud-native metrics solution to ingest, alert on, and query your Prometheus metrics, which provide visibility to the health and performance of your infrastructure and applications. Azure monitor container insights increases your visibility with a fully managed cloud-native logs solution for advanced troubleshooting by analyzing container stdout, stderr, and infrastructure logs. You can quickly identify and mitigate latency and reliability issues using distributed traces with Azure Monitor application insights with preview OpenTelemetry-based instrumentation, which is a fully managed application and performance monitoring (APM) solution. Take your DevOps and site reliability engineering productivity to the next level with the new Azure Managed Grafana with plugins for Azure Monitor, which gives you a fully managed service for full-stack troubleshooting dashboards.

Let’s take a look at how simple it is to configure the monitoring for your kubernetes clusters with Azure Monitor and how to quickly identify the issues across each layer of your full cloud-native stack.
Monitor with highly available, scalable, and secure managed service for Prometheus
Prometheus has become a de facto standard for Kubernetes monitoring to collect a rich set of metric types and visualize them with Grafana, which offers a huge set of community dashboards. However, running self-managed Prometheus is challenging to scale for enterprise workloads, requiring significant time and bandwidth to set up and maintain Kubernetes monitoring deployments. We are introducing Azure Monitor Managed service for Prometheus (preview) to overcome the challenges of self-managed Prometheus and help you accelerate innovation by carrying out frequent high-scale deployments for your services.
Azure Monitor managed service for Prometheus (preview) is a fully managed service that provides a highly available, scalable, and enterprise-grade secure service to easily monitor applications and services running in a containerized environment. Use it as a drop-in replacement for self-managed Prometheus or as remote storage option. Our remote write interface allows you to continue using your self-managed Prometheus, adding the benefits of our managed service such as high-availability, scaling, monitoring across clusters, and long-term data retention.
Easily troubleshoot issues with logs
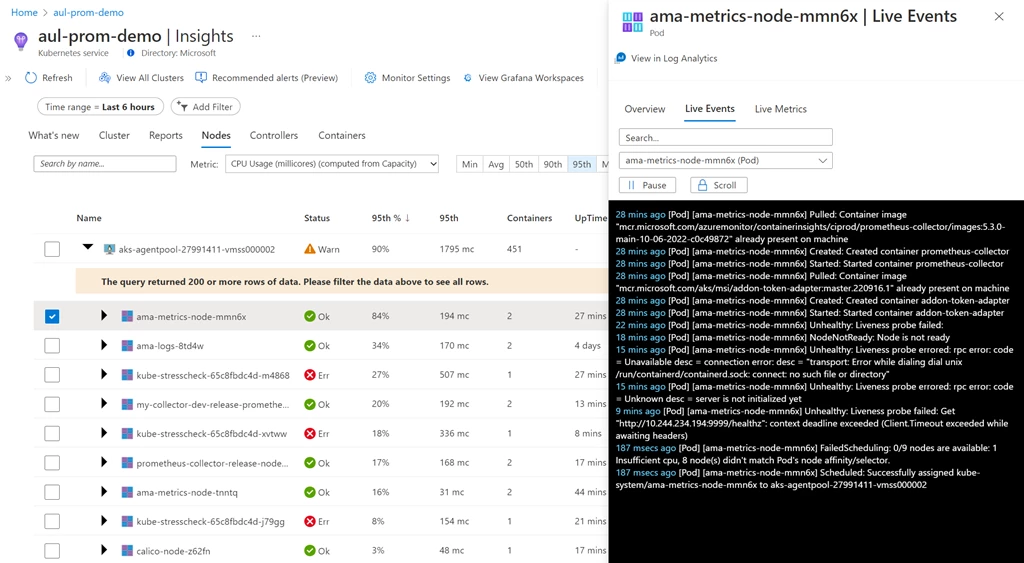
With Azure Monitor’s unified cloud-native offering for Kubernetes monitoring, you can easily set up log collection alongside managed service for Prometheus. Azure Monitor container insights collects troubleshooting logs, provides recommended alerts to proactively identify issues, and has visualizations to monitor health and performance of your Kubernetes cluster. It complements Prometheus and Grafana for end-to-end Kubernetes monitoring across microservices and infrastructure. With Azure Monitor, you can easily:
• Identify any resource bottlenecks and perform advanced debugging for any implicit failures.
• Proactively lookout for any failures or outages by configuring alerts and notifications on Prometheus metrics and container logs.
• Continuously observe the overall health of your infrastructure and correlate metrics and logs under a single view.

Observe your full-stack with Azure Managed Grafana and OpenTelemetry-based instrumentation
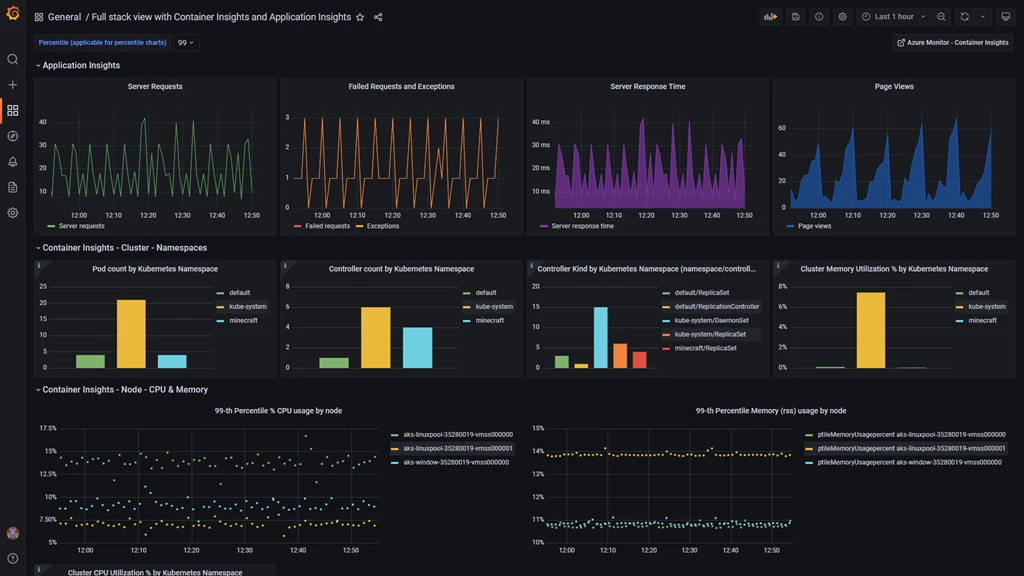
Once you have the monitoring data, it is imperative to bring it all together for continuous observability. To gain more insights for the data you collect, link Azure Managed Grafana to managed service for Prometheus. This offers a curated set of popular open source Grafana dashboards built on top of Prometheus metrics out-of-the-box. You can also combine application metrics and infrastructure metrics from various data sources into a single dashboard for full-stack observability.

At the application layer, Azure Monitor’s preview OpenTelemetry-based instrumentation allows you to use open source technologies to collect additional telemetry from within your application components. We are announcing new capabilities for our preview OpenTelemetry-based offering including metrics, sampling, and resilient data transport. This makes it easier to start using OpenTelemetry APIs with Azure Monitor Application Insights. There’s no need to configure additional agents or other system processes on your cluster. In the video below, check out our recent progress in bringing OpenTelemetry and Grafana to Azure and learn more about the value they can bring to your project.
As cloud-native technologies become central to digital transformation, we are focused on empowering developers to unlock productivity and innovation. We continue to innovate and add more capabilities that allow you to provide performant and reliable experiences to your customers. Get started with monitoring Kubernetes clusters with Azure Monitor.
Learn more
- Learn more about Azure Monitor managed service for Prometheus and read our technical documentation.
- Learn more on how to get started with Azure Monitor’s unified cloud-native offering for Kubernetes monitoring.
- Read the Grafana integrations with Azure Monitor blog.
- Learn more about OpenTelemetry with Azure Monitor.
