Announcements, Azure Monitor, DevOps
Azure Monitor for containers now generally available
Posted on
3 min read
We are happy to announce that Azure Monitor for containers is now generally available. Azure Monitor for containers monitors the health and performance of Kubernetes clusters hosted on Azure Kubernetes Service (AKS). Since the launch of the public preview at Build in May 2018, we have seen a lot of excitement from customers. Customers love the fact that you can enable monitoring as soon as you create an AKS cluster and get all the monitoring telemetry in a centralized location in Azure without having to login to containers or rely on other tools. Since the public preview, we have been adding more capabilities and refining the experience based on your feedback. Let’s look at some of the recent changes.
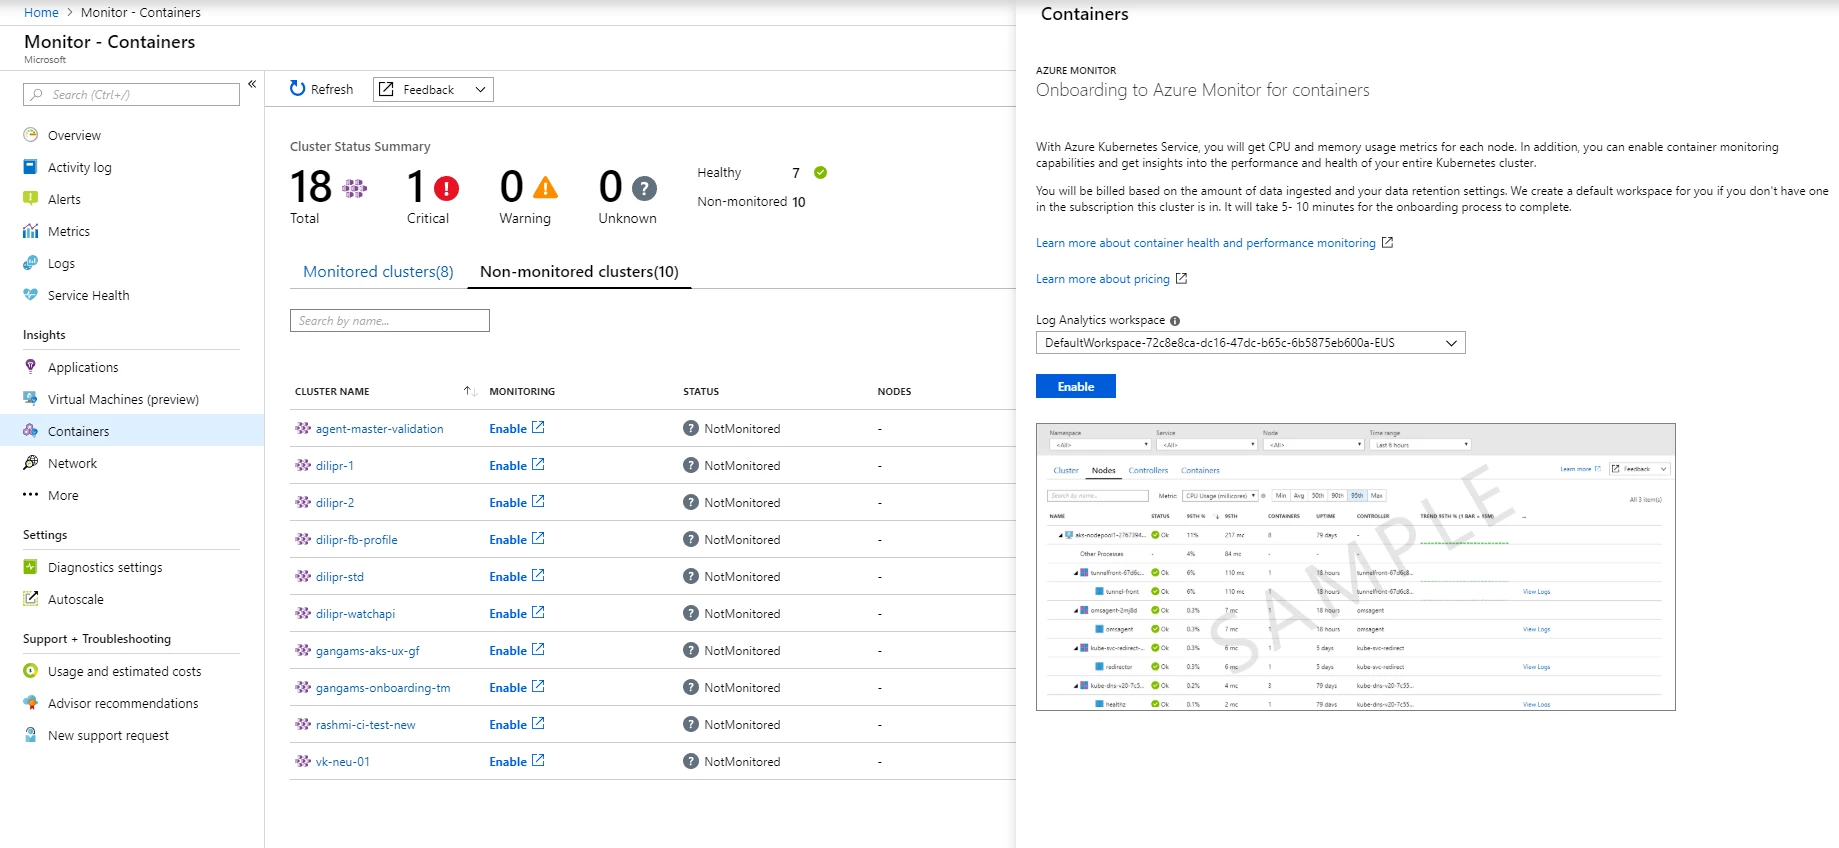
Multi-cluster view – You often have multiple AKS clusters to manage. Wouldn’t it be great to view and manage all your clusters together? The multi-cluster view discovers all AKS clusters across subscriptions, resource group, and workspaces, and provides you a health roll up view. You can even discover clusters that aren’t being monitored and with just few clicks start monitoring them.

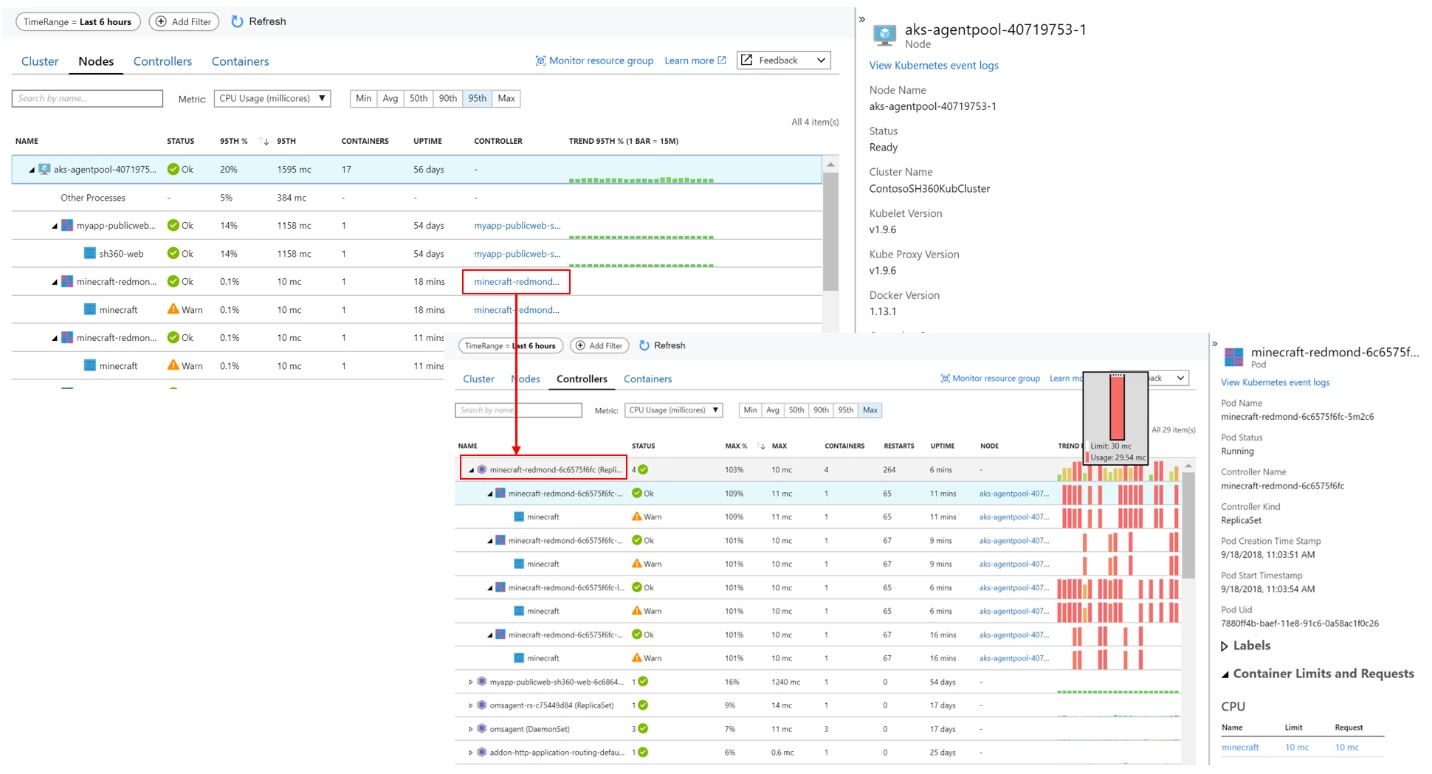
Drill down further into AKS cluster with Performance Grid view – To investigate further, you can drill down to performance grid view that shows the health and performance of your nodes, controllers, and containers. From the node view tab, you can easily spot the noisy neighbor issue on the pod and drill further to see the controller it is part of. You can further see the controller limits, request setting, and actual usage to determine if you have configured your controller correctly. You can continue investigating by looking at the Kubernetes event logs associated to that controller.

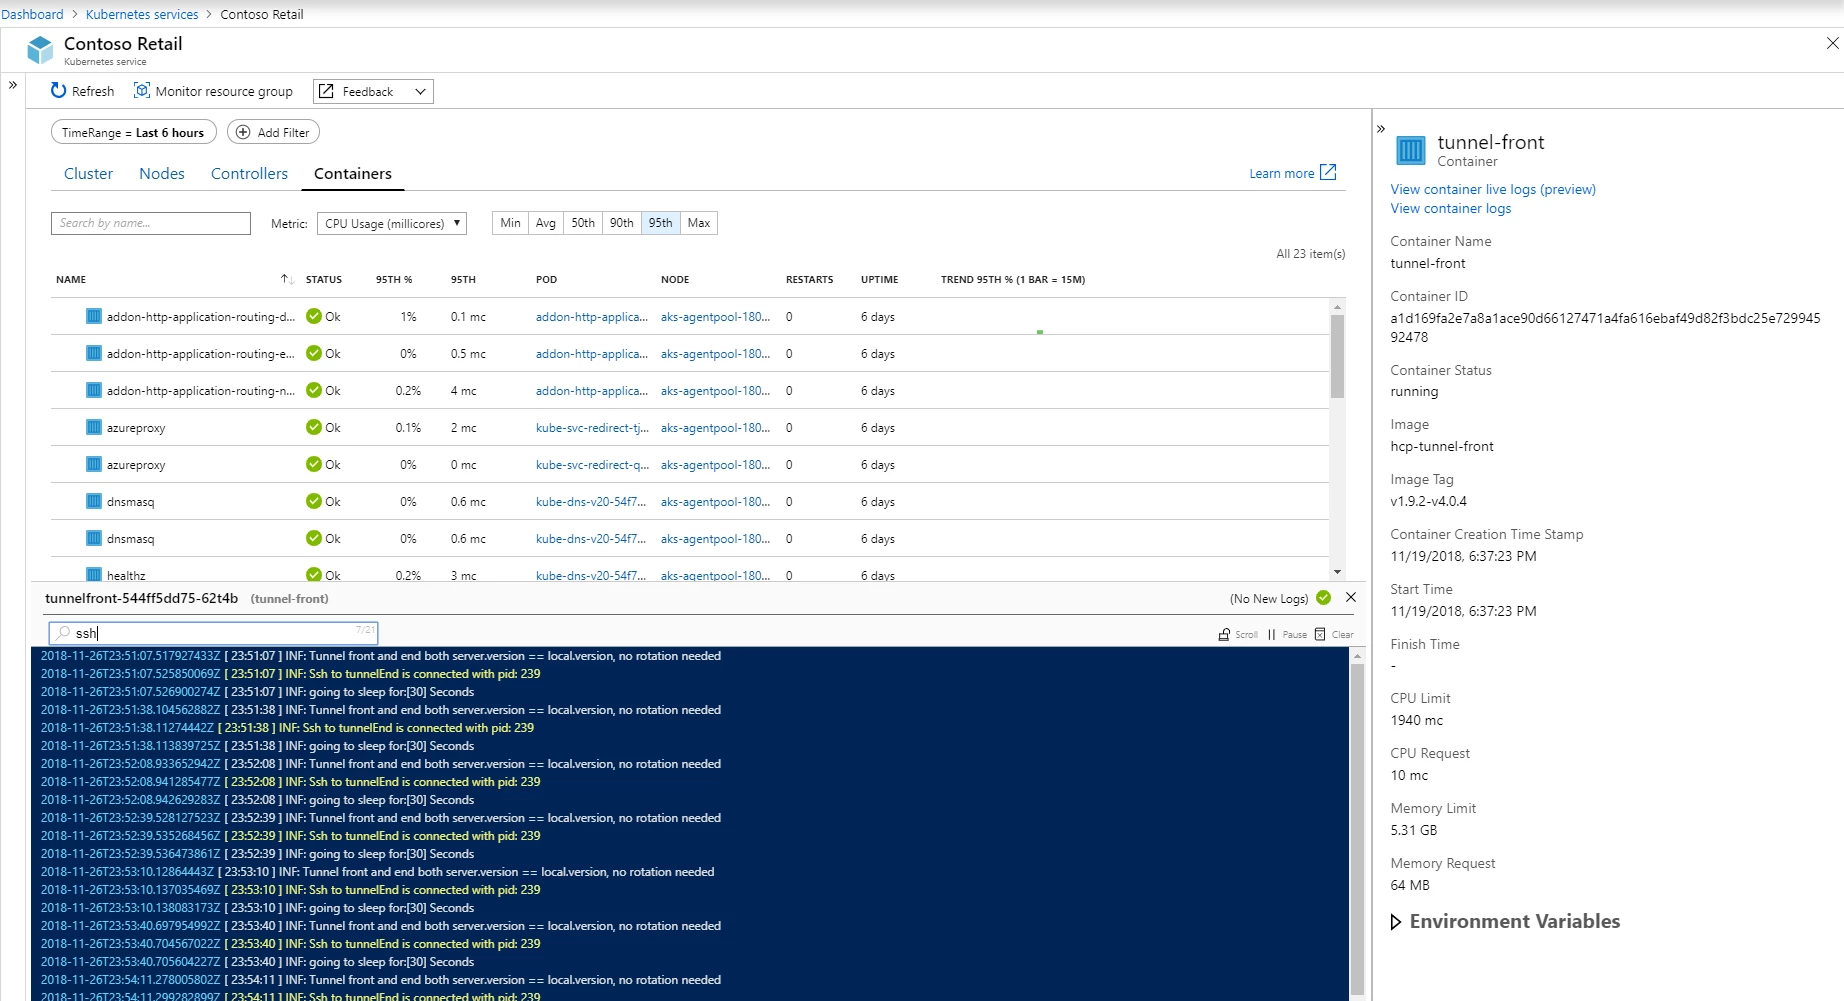
Live debugging – We all know the importance of verifying that your application is working as expected, especially after you deploy an update. With live logs you get a real time, live stream of your container logs directly in your Azure portal. You can pause the live stream and search within the log file for errors or issues. Unlike the Azure Monitor logs, the live stream data is ephemeral and is meant for real time troubleshooting.

Onboarding – In addition to the Azure portal, we have added more ways for you to automate onboarding Azure Monitor for containers.
- Azure CLI and ARM template – With the add-on option you can onboard Azure Monitor for containers with a single command. The command will automatically create the default Log Analytics workspace and deploy the agent for you.
For new AKS clusters:
az aks create --resource-group myAKSCluster --name myAKSCluster --node-count 1 --enable-addons monitoring --generate-ssh-keys
For existing AKS clusters:
az aks enable-addons -a monitoring -n MyExistingAKSCluster -g MyExistingAKSClusterRG
You can also enable monitoring for your containers by using Azure Resource Manager (ARM) template. To learn more, please review the detailed instructions for onboarding using Azure CLI and ARM template.
- Terraform – Similar to ARM template, if you are using Terraform to deploy AKS clusters, you can enable monitoring right from the template. To learn more read the documentation from Terraform on setting up AKS cluster, Log Analytics solution, and workspace.
We would like to conclude with some inspiring words from one of our customers, Hafslund, a Nordic power company, with whom we recently published a case study:
“We found it easy to get Azure Monitor up and running for containers. The metrics and charts right out of the Monitor box are perfect to help us quickly tune our clusters and services and resolve technical issues.”
– Ståle Heitmann, CTO, Hafslund Nett AS
To learn more about Azure Monitor for containers, read our documentation, “Azure Monitor for containers overview.” Thank you for your feedback during the public preview and we look forward to your continued support as we add more exciting features and capabilities to Azure Monitor for containers.