Analytics, Azure HDInsight, Azure Monitor, Best practices, Management and Governance
Monitoring on Azure HDInsight Part 3: Performance and resource utilization
Posted on
5 min read
This is the third blog post in a four-part series on Monitoring on Azure HDInsight. Part 1 is an overview that discusses the three main monitoring categories: cluster health and availability, resource utilization and performance, and job status and logs. Part 2 centered on the first topic, monitoring cluster health and availability. This blog covers the second of those topics, performance and resource utilization, in more depth.
Monitoring performance and resource utilization is a fundamental way to gain better insights into how your cluster is running. You can keep tabs on metrics, such as CPU, memory, and network usage, to better understand how your cluster is handling your workloads and whether you have enough resources to complete the task at hand. Azure HDInsight offers two tools that can be used for monitoring cluster resource utilization: Apache Ambari and integration with Azure Monitor logs. Apache Ambari is included on all Azure HDInsight clusters and provides an easy-to-use web UI that can be used to monitor the cluster and perform configuration changes. Azure Monitor logs collects metrics and logs from multiple resources, including HDInsight clusters, into a Log Analytics workspace. A Log Analytics workspace presents your metrics and logs as structured, queryable tables which can be used to configure custom alerts.
Apache Ambari
Dashboard
The Ambari dashboard contains a slew of widgets that show metrics designed to give a glanceable overview of your cluster. These widgets show general usage metrics, such as cluster CPU, memory, and network usage, as well as metrics specific to certain cluster types, like YARN ResourceManager information for Spark/Hadoop clusters and broker information for Kafka clusters.
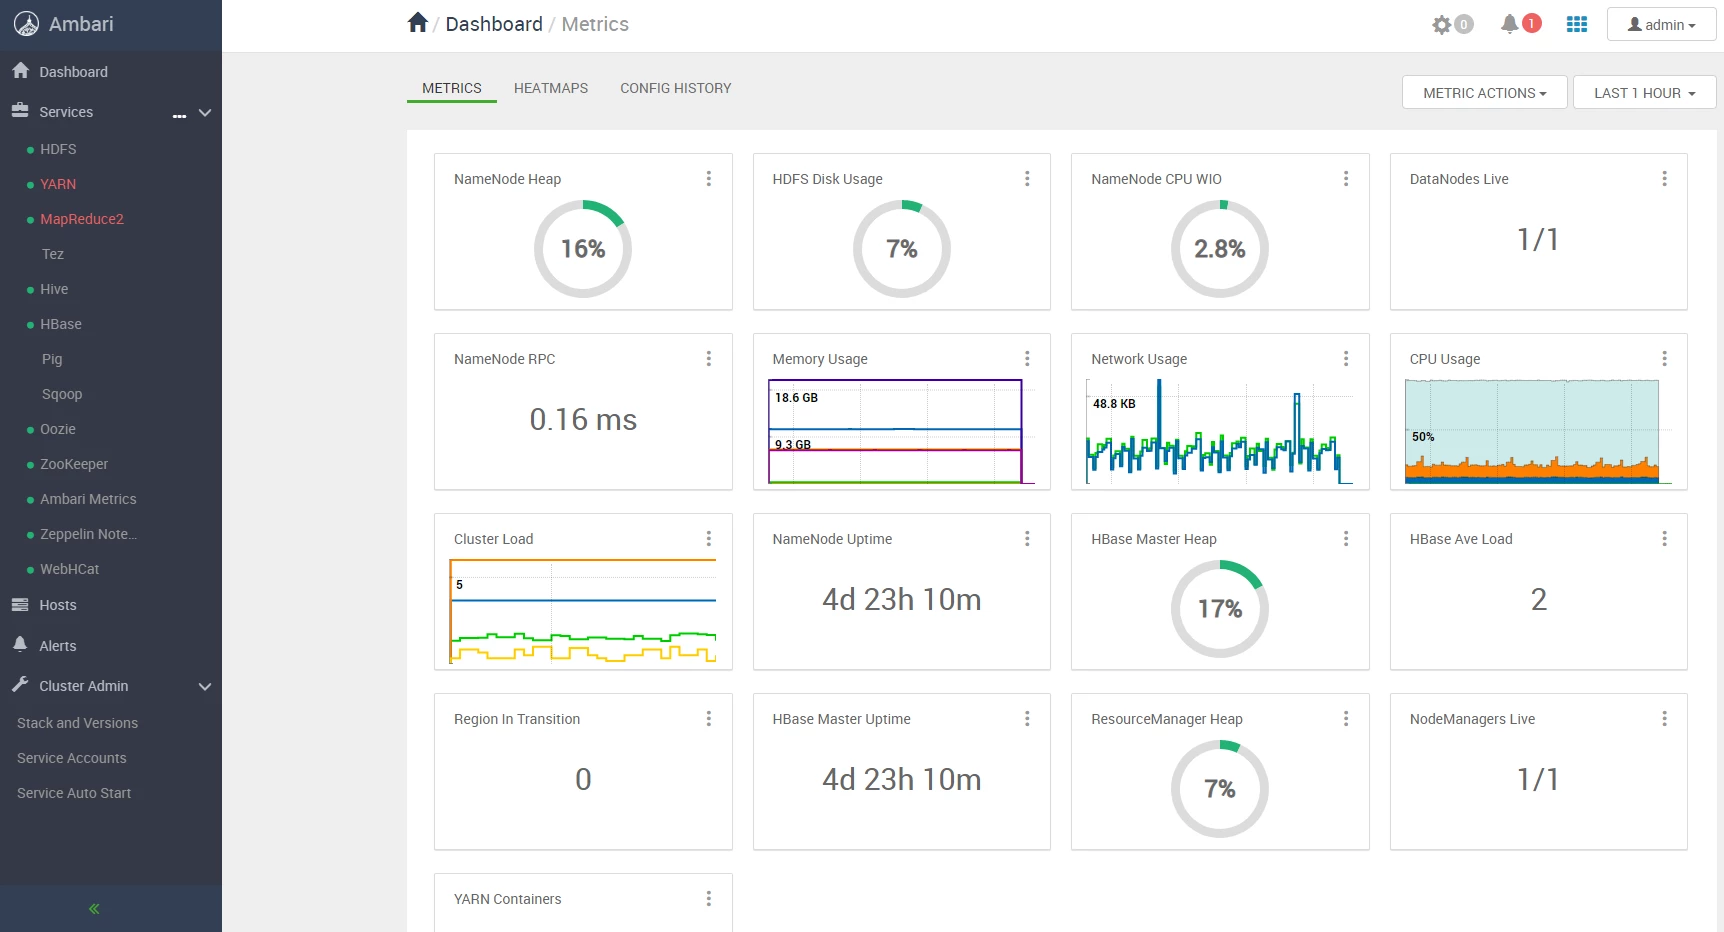
The Ambari Dashboard, included on all Azure HDInsight clusters.
Hosts
Ambari also provides a hosts tab that enables you to view utilization metrics on a per-node basis. The hosts tab shows glanceable statistics for all nodes in the cluster. Selecting the name of a node opens a detailed view for that node, which shows graphs for host metrics.
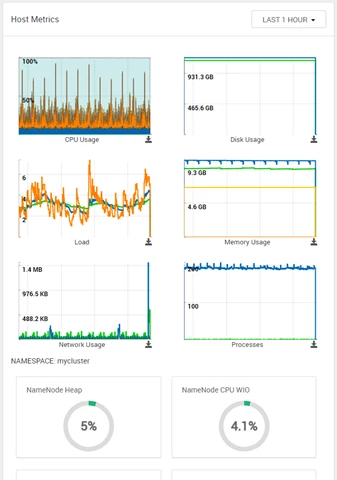
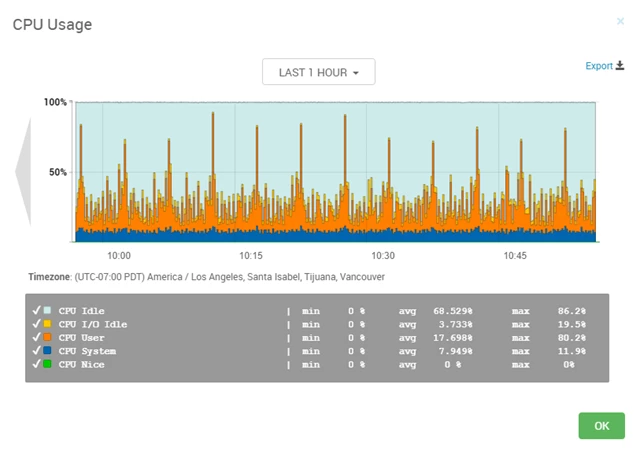
The Ambari Hosts view shows detailed utilization information for individual nodes in your cluster.
To drill down further into any particular utilization host metric, select a graph to show a breakdown of metrics displayed in that graph.
Alerts
Ambari also provides several configurable alerts out of the box that can provide notification of specific events. Alerts are shown in the upper-right corner of Ambari on HDInsight 4.0 as a bell icon accompanied by a red badge containing the number of active alert notifications.
Ambari offers many predefined alerts you can use to monitor performance, including:
|
Alert Name |
Description |
|
ResourceManager CPU Utilization |
This host-level alert is triggered if CPU utilization of the ResourceManager exceeds certain warning and critical thresholds. It checks the ResourceManager JMX Servlet for the SystemCPULoad property. |
|
HBase Master CPU Utilization |
This host-level alert is triggered if CPU utilization of the HBase Master exceeds certain warning and critical thresholds. It checks the HBase Master JMX Servlet for the SystemCPULoad property. |
|
Host Disk Usage |
This host-level alert is triggered if the amount of disk space used goes above specific thresholds. The default threshold values are 50 percent for WARNING and 80 percent for CRITICAL. |
|
History Server CPU Utilization |
This host-level alert is triggered if the percent of CPU utilization on the History Server exceeds the configured critical threshold. The threshold values are in percent. |
The detailed view for each alert shows a description of the alert, the specific criteria or thresholds that will trigger a warning or critical alert, and the check interval for the criteria. The thresholds and check interval can be configured for individual alerts.
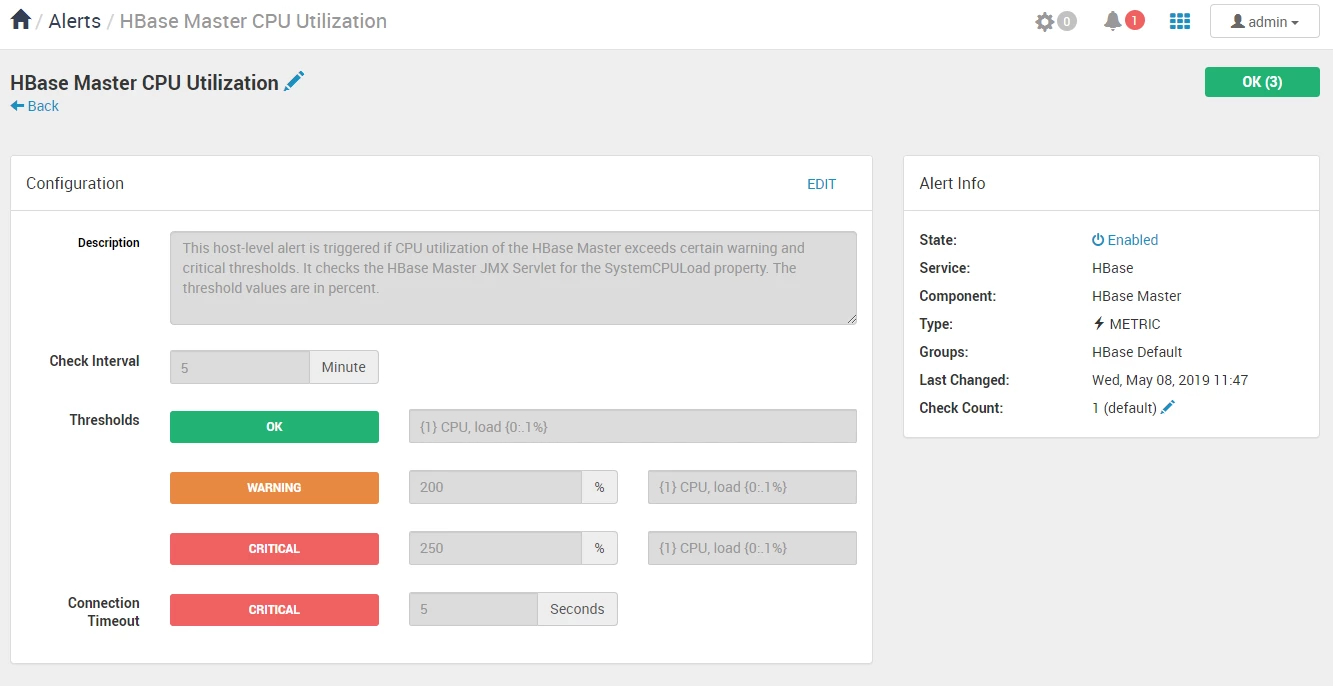
The Ambari detailed alert view shows the description of the alert and allows you to edit the check interval and thresholds for the alert to fire.
You can also optionally configure email notifications for Ambari alerts. Ambari email notifications can be a good way to monitor alerts when managing many HDInsight clusters.

Configuring Ambari email notifications can be a useful way to be notified of alerts for your clusters.
Azure Monitor logs
Azure Monitor logs enables data generated by multiple resources such as HDInsight clusters, to be collected and aggregated in one place to achieve a unified monitoring experience. As a prerequisite, you will need a Log Analytics Workspace to store the collected data. If you have not already created one, you can follow the instructions for creating a Log Analytics Workspace.
You can then easily configure an HDInsight cluster to send a host of logs and metrics to Log Analytics. Once Azure Monitor logs integration is enabled, you can configure the Log Analytics workspace to collect Linux performance counters from the nodes and send them to your Log Analytics workspace.
HDInsight monitoring solutions
HDInsight offers workload-specific, pre-made monitoring dashboards in the form of solutions that can be used to monitor cluster resource utilization. Learn how to install a monitoring solution. These solutions allow you to monitor metrics like CPU time, available YARN memory, and logical disk writes across multiple clusters. Selecting a graph takes you to the query used to generate it, shown in the logs view.
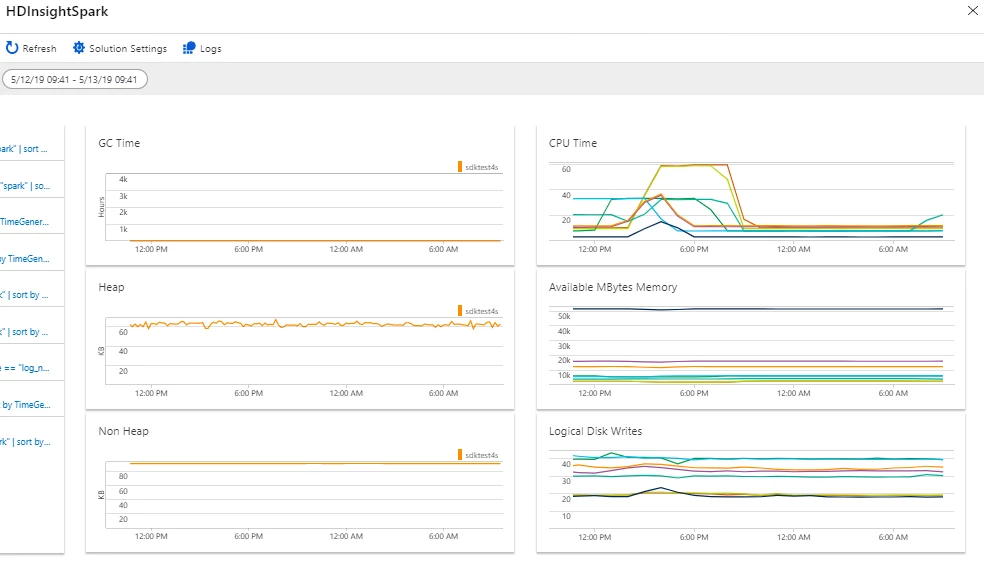
The HDInsight monitoring solutions provide a simple pre-made dashboard from which you can monitor a host of utilization metrics.
Query metrics in the logs blade
You can also use the logs view in your Log Analytics workspace to query the metrics tables directly.
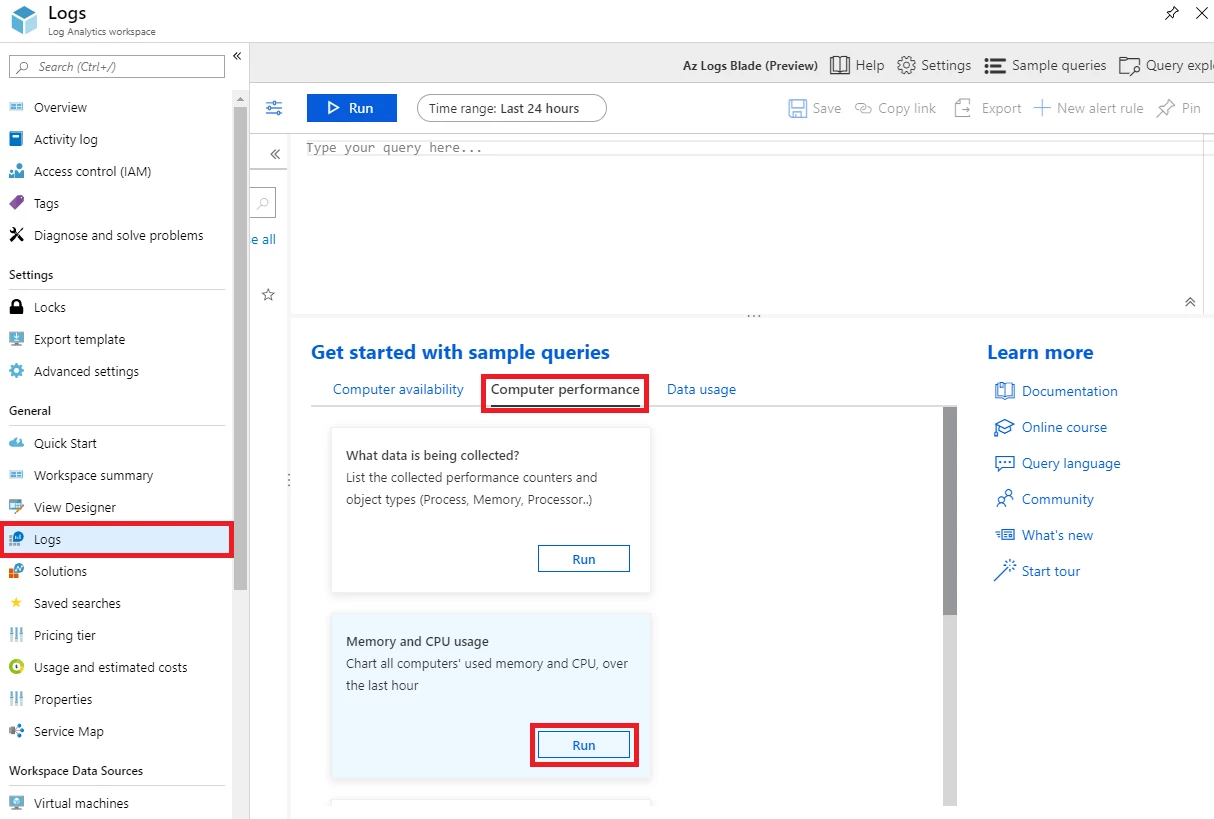
The Logs blade in a Log Analytics workspace lets you query collected metrics and logs across many clusters.
The computer performance tab in the logs blade of your Log Analytics Workspace lists a number of sample queries related to availability, such as:
|
Query Name |
Description |
|
What data is being collected? |
List the collected performance counters and object types Process, Memory, Processor. |
|
Memory and CPU usage |
Chart all computers’ used memory and CPU, over the last hour. |
|
CPU usage trends over the last day |
Calculate CPU usage patterns across all computers, chart by percentiles. |
|
Top 10 computers with the highest disk space |
Show the top 10 computers with the highest available disk space. |
Azure Monitor alerts
You can also set up Azure Monitor alerts that will trigger when the value of a metric or the results of a query meet certain conditions. You can condition on a query returning a record with a value that is greater than or less than some threshold, or even on the number of results returned by a query. For example, you could create an alert to send an email if CPU usage stays above a defined threshold for a sustained period of time.
There are several types of actions you can choose to trigger when your alert fires, such as an email, SMS, push, voice, an Azure Function, a LogicApp, a Webhook, an ITSM, or an Automation Runbook. You can set multiple actions for a single alert. Find more information about these different types of actions by visiting our documentation, “Create and manage action groups in the Azure portal.”
Finally, you can specify a severity for the alert in addition to the name. The ability to specify severity is a powerful tool that can be used when creating multiple alerts. For example, you could create one alert to raise a Warning (Sev 1) alert if a single head node becomes unavailable and another alert that raises a Critical (Sev 0) alert in the unlikely event that both head nodes go down. Alerts can be grouped by severity when viewed later.
Next steps
Between Apache Ambari and Azure Monitor logs integration, Azure HDInsight offers comprehensive solutions for monitoring the performance and resource utilization of all your clusters. For more information see our documentation, “Monitor cluster performance.”
If you haven’t read the other parts in this series, you can check those out here:
- Monitoring on Azure HDInsight Part 1: An Overview
- Monitoring on Azure HDInsight Part 2: Cluster health and availability
Stay tuned for the next part in the Monitoring on Azure HDInsight blog series.