At Microsoft Ignite 2018, we shared our vision to bring together infrastructure, application, and network monitoring into one unified offering, and provide full-stack monitoring for your applications. We have since made rapid strides towards delivering that reality to our customers. From consolidating our logs, metrics and alerts platforms, and integrating existing capabilities such as Application Insights and Log Analytics, to adding new monitoring capability containers and virtual machines, and contributing back to the community through open-source projects such as OpenTelemetry. In this blog, I’ll share the newest enhancements from Azure Monitor at Microsoft Ignite, including four examples of how we continue to build seamless, and integrated monitoring solution that works well for cloud-native and legacy workloads and is cost-effective. Be sure to read the full blog post to get a list of all the exciting enhancements.
Monitor containers anywhere
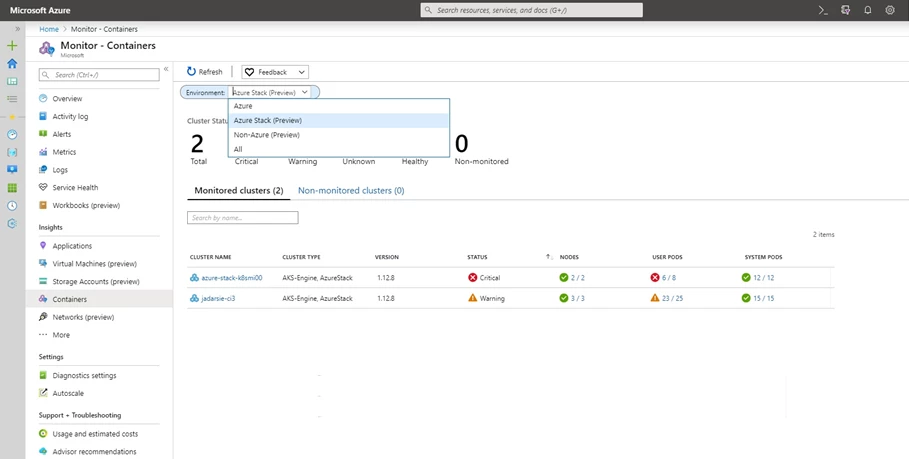
Customers love the convenience of the out of the box monitoring that Azure Monitor for containers provides for all their Azure Kubernetes Service (AKS) clusters. But, you also have Kubernetes clusters running outside AKS. For customers who have hybrid environments, we are now launching the ability to monitor Kubernetes clusters on-premises and on Azure Stack (with AKS Engine) in preview. Just install the container agent and you can create alerts and get insights into the performance of your on-premises workloads in the Azure portal, along with your AKS workloads. Learn more about hybrid Kubernetes monitoring.

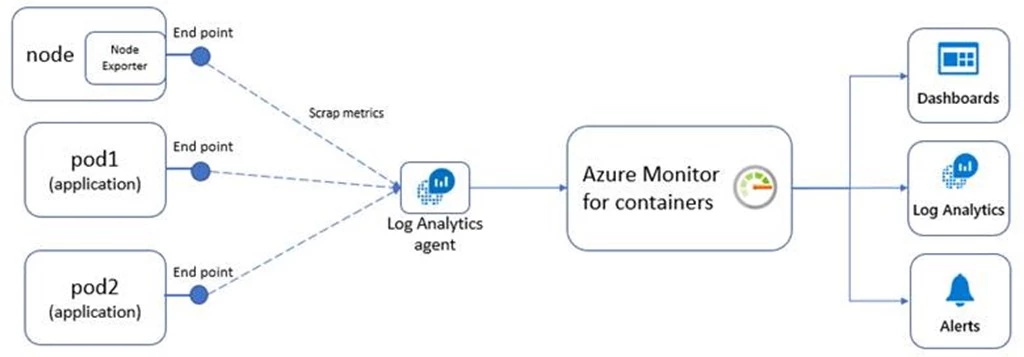
We are also making the popular Prometheus integration generally available. Azure Monitor can now scrape your Prometheus metrics and store them on your behalf, without you having to operate your own Prometheus collection and storage infrastructure. We also have new Grafana templates for you to visualize all the performance data that is collected from your Kubernetes clusters. Learn more about the Prometheus integration and Grafana templates.

Troubleshooting network issues faster
Monitoring a typical cloud network containing application gateways, VPN connections, virtual networks, etc., is a time-consuming activity. To troubleshoot an issue, you need to know the specific networking resources that support your application and scan for the health of these resources across multiple subscriptions and resource groups.
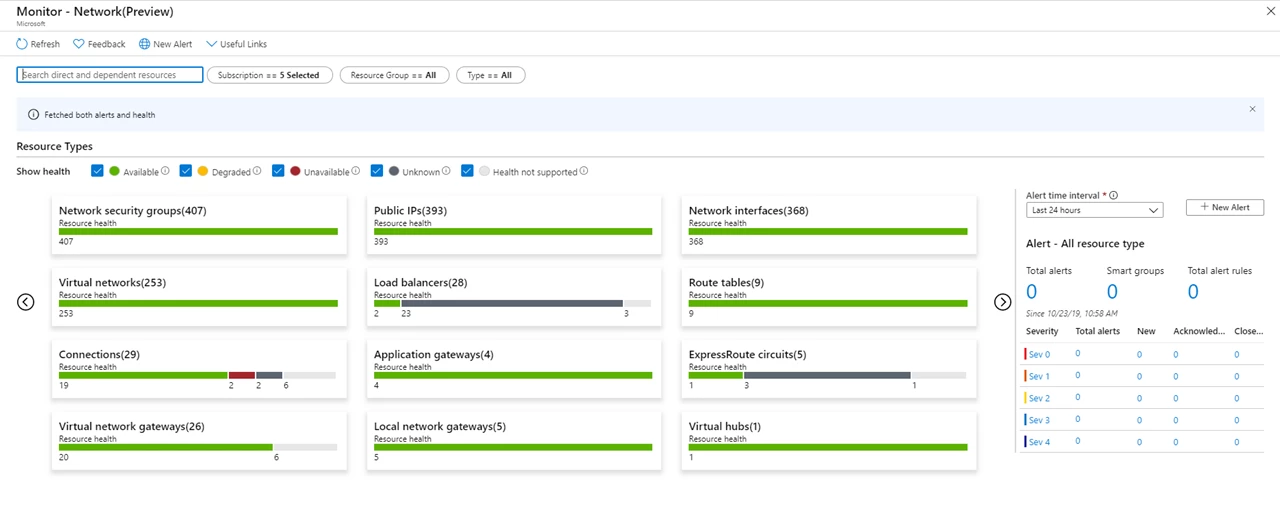
The Network Insights preview in Azure Monitor provides a single dashboard that gives you visibility into network topology, dependencies, health, and other key metrics for related network resources. The insights are derived from data that’s available in Azure Monitor today, so no additional setup or configuration is required.

With Network Insights, you have visibility into the health of your network across all of your subscriptions. Intuitive search and detailed topology maps enable faster drill-downs, help localization of networking issues, and suggest remediation in a matter of minutes. Learn more about Network Insights.
Work better and collaborate with workbooks
We’ve gotten great feedback from customers on Azure Monitor workbooks because it gives you a single tool that can combine text, analytic queries, metrics, and parameters into a rich interactive report that you can share with your team members and collaborate.

We have seen customers use workbooks in several ways including exploring the usage of an app, going through a root cause analysis, putting together an operational playbook, and more. We are now making workbooks generally available. Since the launch in preview, we have added support for a number of new data sources, including Azure Data Explorer, Azure Resource Graph, Azure Monitor Logs, Metrics, Alerts, etc., and added visualization options such as charts, grids, tiles, honeycombs, and maps. The Azure Monitor Workbook platform now forms the basis of new monitoring experiences in Azure services such as Azure Sentinel, Storage accounts, Azure Cosmos DB, Azure Active Directory, and SAP Hana. Learn more about Azure Monitor workbooks.
In addition to the highlights of the innovation that we are driving above, here are even more detailed new capabilities we’re delivering today:
- New agent and additions to profiling and tracing capabilities in Application Insights: For customers who have ASP.NET applications hosted on Azure Virtual Machines (VMs) running IIS, we are adding a new “codeless” onboarding method that uses an agent and does not require access to the code. Learn more.
- We’ve added the ability to specify central processing units and memory thresholds for the Application Insights Profiler, so you have better control of when to collect traces. Learn more.
- We’ve also added a source code view (via decompilation) in Application Insights Snapshot Debugger to allow you to quickly diagnose the failing code.
- Application change analysis enhancements: We have added a lot of features for application change analysis to help you scale. We have introduced the ability to turn on application change analysis at an App Services plan level, you can now see resource manager changes for any resource, and there are richer diagnostics for common scenarios (such as VMs + VNET, SQL server, and Storage). We also added an impact analysis feature to see downstream dependencies for a change and revamped the user experience. Learn more.
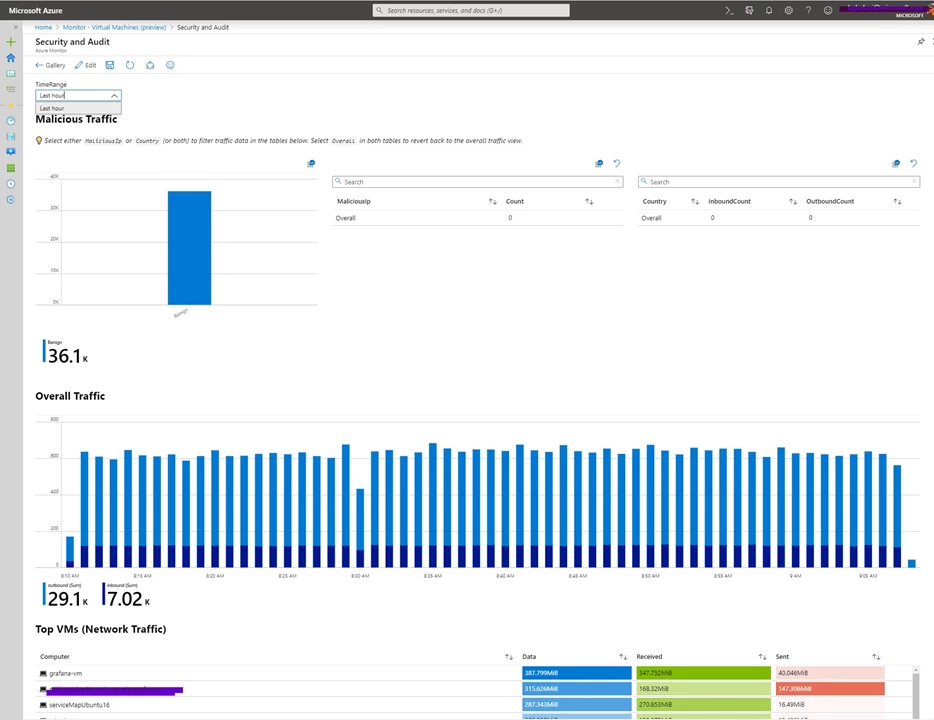
- Traffic Analytics accelerated processing: The new accelerated processing option in Traffic Analytics allows you to process NSG Flow logs at 10-minute intervals. Learn more.
- Live container metrics and live deployments (preview): We are adding the ability to see live performance metrics and live deployments in your AKS cluster. Together with the live events and live logs features, you can get a near real-time performance and health view of your AKS cluster and troubleshoot issues faster.
- Log integrations: Using the new Subscription Diagnostic settings, you can now stream every type of activity log for your subscription to Azure Monitor Logs, Event Hub, and Storage and no longer need Subscription Log Profiles or Log Analytics Activity Log connector. In addition, you can now export log data from services such as Azure App Services directly Azure Monitor. These features are available for free while in preview.
- Azure Monitor for Cosmos DB: You can now view usage, failures, capacity, throughput, and operations for your Azure Cosmos DBs across your subscriptions. You can see the rollups at subscription, Azure Cosmos DB level or the individual container level and then drill through to the resource for further troubleshooting.
Our customer feedback has been instrumental in shaping these features, and we hope you’ll keep the feedback coming. If you have any questions or suggestions, reach out to our Tech Community forum.
Azure. Invent with purpose.