Azure Monitor, DevOps, Management and Governance
End-to-end monitoring solutions in Azure for Apps and Infrastructure
Posted on
3 min read
Today at the Ignite 2017 conference in Florida, we announced a range of new monitoring and analytics capabilities in Azure bringing together application and infrastructure monitoring in a unified curated overview in Azure Monitor. We are significantly optimizing your experience with the new log analytics, metrics exploration, application performance monitoring and failure investigations. We also announced integration of Azure alerts with IT Service Management tools and new solutions for Container Monitoring.
Bringing together monitoring services in Azure Monitor
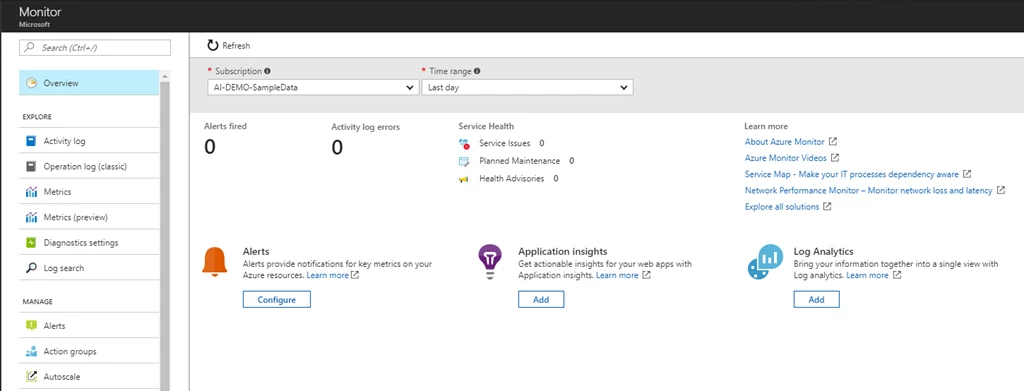
From Azure Monitor you can now get at-a-glance reporting on the health and performance of all your cloud resources, from virtual machines to applications to individual lines of codes in the applications. Azure Monitor will now offer in public preview a unified overview as a starting point for navigation and on-boarding to various monitoring services in Azure. Customers will be able to see notable issues across applications & infrastructure in a single place and navigate to them in context.
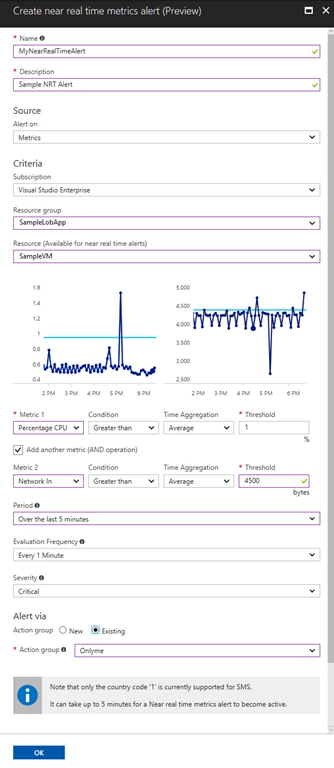
Azure Monitor will now provide near real-time alerting in public preview for platform metrics from Azure services such as Virtual Machines, Networking, ServiceBus, EventHubs, etc. A complete list of all resources supported by near real-time alerting can be found here in our documentation. Azure Monitor is also enabling new metrics and logs to be surfaced from many services such as, Networking, Storage, Traffic Manager, Network Interfaces, Express Routes, Load Balancers, Data Lake Store, Data Lake Analytics, etc. A complete list of all the resources and their metrics available via Azure Monitor can be found here in our documentation.
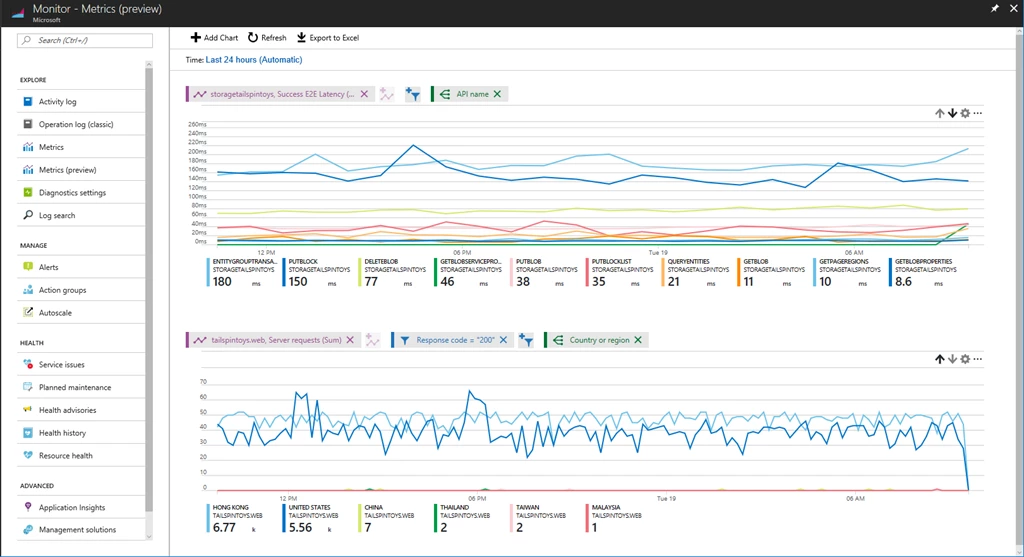
 Also released for Azure Monitor is a public preview of a completely revised metrics exploration experience that now supports rendering charts for both multi-dimensional and basic metrics. You can plot charts overlaying metrics from different resources and simultaneously view multiple charts to visually correlate trends, spikes and dips in metrics values. For the resources that support multi-dimensional metrics (e.g. Application Insights or Storage), you can apply filters on the desired dimension/value combinations, and/or add grouping to see a line for each dimension value.
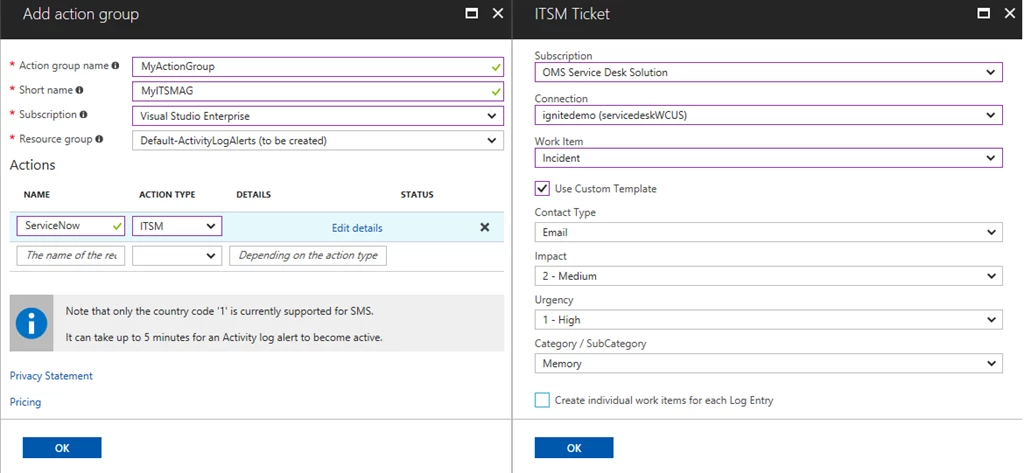
Azure Monitor is enabling integration with your IT Service Management (ITSM) tool of choice (System Center Service Manager, Service Now, Provance or Cherwell) through the new ITSM action in Action groups. The ITSM action enables users to automatically create work items (incidents, events or alerts) in their ITSM tool when an Azure alert fires. This ITSM action is built on top of ITSM Connector Solution in Azure Log Analytics. Through the solution, customers can combine the power of help desk data (such as incidents and change requests) and log data (such as activity and diagnostic logs, performance and configuration changes) to mitigate incidents quickly.
New Log Analytics & Container Monitoring Solutions
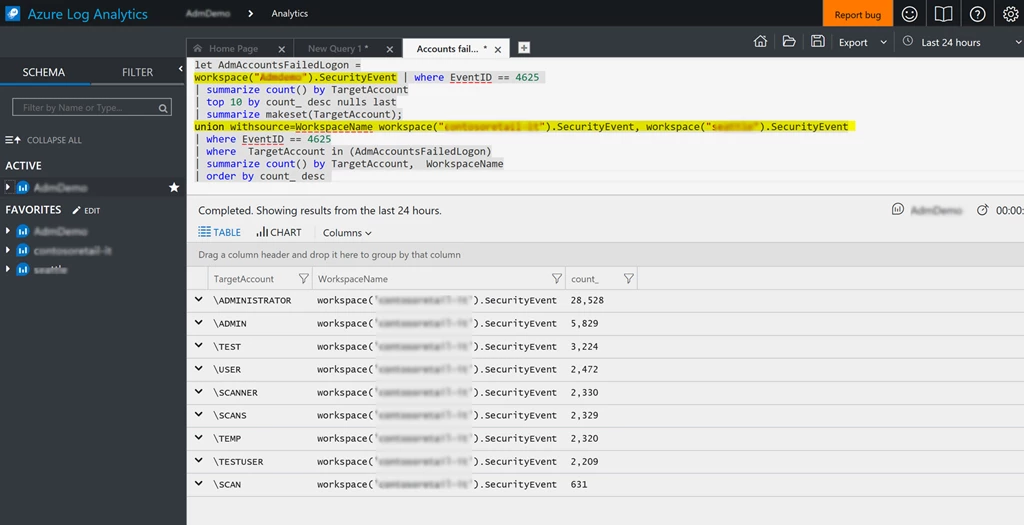
Azure Application Insights and Azure Log Analytics are offering a public preview of cross-resource querying, which will allow users to query across multiple Application Insights applications or multiple Log Analytics workspaces. This will enable querying across multi-tiered or geo-distributed applications as well as across multiple logical infrastructure groups. The new and improved Log Analytics, whose upgrade rollout was launched a month ago, is now providing REST APIs for the new query language.
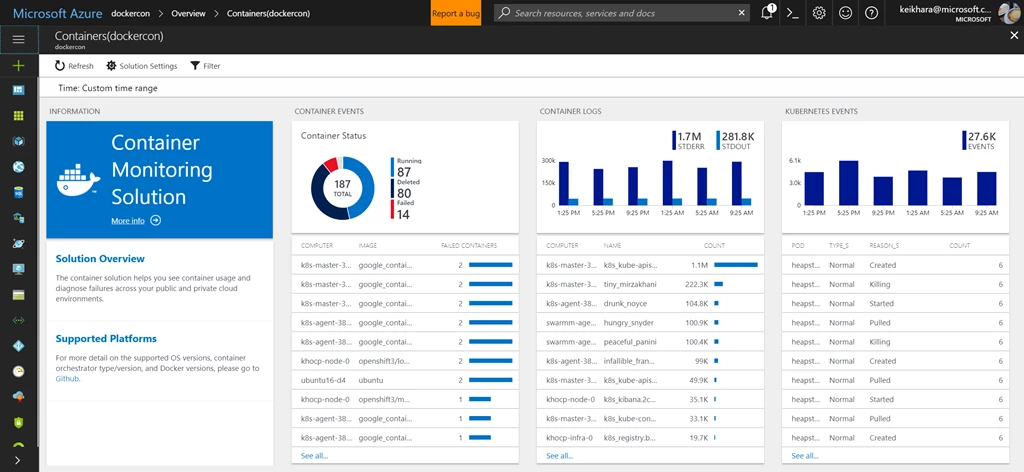
Container Monitoring Solution is now supported for Windows Kubernetes Environment providing container monitoring for performance, logs, events, and inventory as well as Kubernetes events. Helm, a package manager which helps, share, and use software built for Kubernetes, is getting the solution integrated, enabling customers to easily find and deploy Container Monitoring onto their Linux Kubernetes environment. With the GA of Service Fabric on Linux as a container orchestrator, Log Analytics will be capturing container monitoring information with the Azure Monitoring Agent.
Revamped user experience in Azure Application Insights
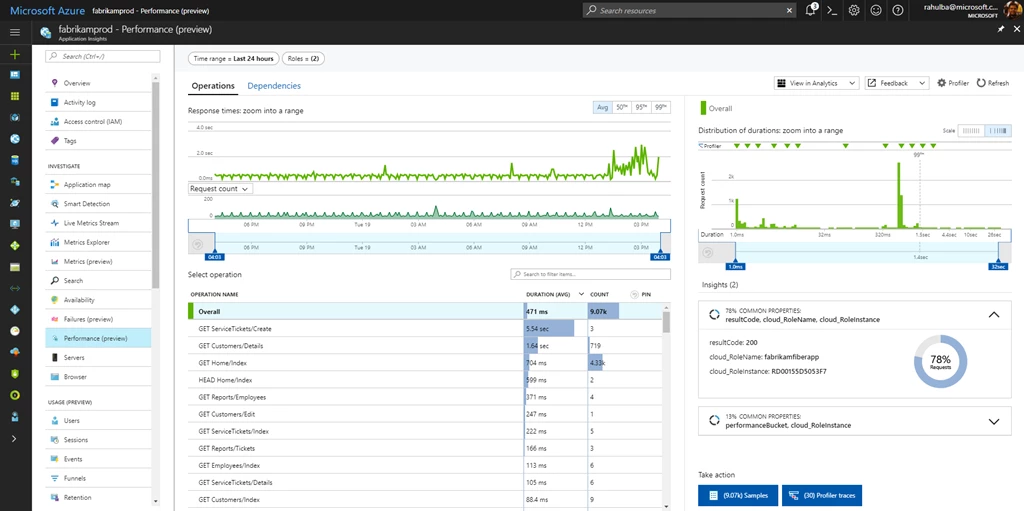
Application Insights has completely refreshed the user experience for Performance Monitoring and Failure Diagnostics (in public preview) to provide an interactive experience and show contextual insights. Customers can now quickly triage which specific end-user experiences are slow in production and visualize a duration distribution to get a holistic statistical view of both the good and the bad user experiences. Effective transitions to code level visibility (profiler) and diagnostic information on slow dependencies are only a click away.
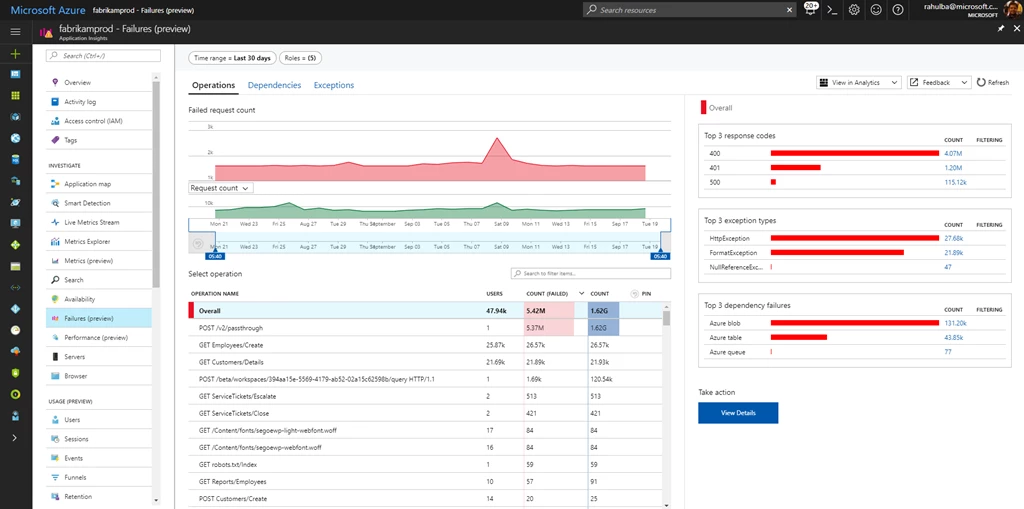
With the new failure investigation experience, you can quickly identify and fix your top failing operations, exception types, failing dependencies behind their failures and see how end users are impacted.
Visual Studio Mobile Center announced that their users can now connect to Application Insights and continuously export a copy of all their usage telemetry events. From there, they can query and analyze their Mobile Center data with the richer set of capabilities that Application Insights provides around ad-hoc querying, filtering, segmentation, and richer usage analytics.
Get started today
Azure monitoring and analytics services help you to gain greater visibility into your environment with advanced data analysis and visualization, and make it easy to turn insights into action. Learn more about the capabilities of our Monitoring Solutions, and how they can help you reduce complexity for a hybrid cloud environment.