Collecting insights using Azure Monitor
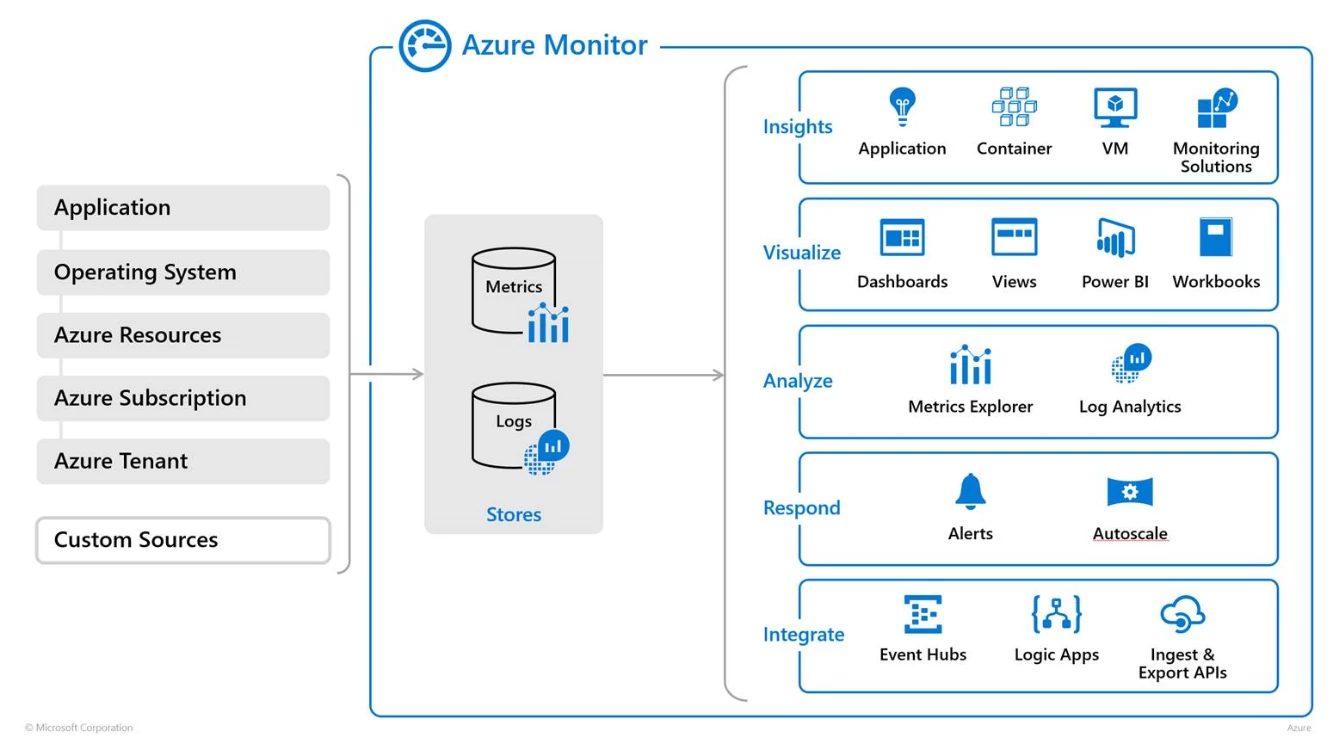
Azure Database for PostgreSQL and MySQL service is a fully managed, enterprise-ready cloud service which emits the performance metrics and telemetry log to Azure Monitor service. Using Azure Monitor, you can collect, analyze, and take action on telemetry data gathered from your cloud environments. This then helps you understand how the application is behaving, get deep insights into application and database behavior, get alerts, and build remediation action to respond to the alerts. Azure Monitor collects data from various monitored Azure resources, including Azure Database for PostgreSQL and MySQL. From the metrics and data collected, the tool service enables various operations including streaming data into external partner systems.

You are able to monitor your applications running on Azure Database for PostgreSQL or MySQL via the Azure portal. For each of the Azure Database for PostgreSQL or a MySQL server, a full suite of metrics is available to monitor throughput, storage, availability, and latency. Here are the various metrics available for you in Azure Database for PostgreSQL and MySQL to get insights on server’s behavior. You can also set alerts to monitor these metrics and log data using the Azure Portal or Azure CLI. For more information on monitoring data collected by Azure Monitor, see the Azure Metrics Overview. We have also previously blogged about the best practices for alerting on metrics for Azure Database for MySQL and PostgreSQL.
Azure Monitor integration with partners
If you are already using other third-party monitoring solutions, such as Splunk and Grafana, and so forth, you can now use it to monitor Azure services and applications, too. Thanks to the Azure Monitor data source plugins built by our partners. These plugins enable you to include metrics from Azure Monitor in your monitoring dashboards. Please visit the data source plugin installation page to review the setup instructions for Grafana.
For more information, check out the full list of Azure Monitor partner integrations and learn more about the individual partner plugins.
More options for monitoring your PostgreSQL/MySQL database and applications
Datadog is an essential monitoring platform for cloud applications. It brings together data from servers, containers, databases, and third-party services to make your stack entirely observable. This service enables developer and operations teams to work collaboratively to avoid downtime, resolve performance problems, and ensure that development and deployment cycles finish on time.
Datadog’s vendor supported integrations with Azure Database for MySQL and Azure Database for PostgreSQL collect time series metrics, metadata, and custom tags from Azure Monitor and Azure Resource Manager to allow for flexible dashboarding, alerting and analytics. Additionally, Datadog has agent-level PostgreSQL and MySQL integrations that collect deeper and more fine-grained database metrics and logs. You can view this data in one place alongside information from the rest of your Azure environment and your entire stack in Datadog.
Datadog also offers distributed tracing and logs management tools which allow you to move seamlessly and quickly between related sources of monitoring data without switching tools. To learn more about Datadog and sign up for a 14-day free trial, check out their website.
Feedback
We are always listening to our customers and improving the services, so please continue to provide feedback on what monitoring improvements you want to see for these Azure DB for PostgreSQL and MySQL services. Follow us on Twitter @AzureDBMySQL and @AzureDBPostgres for the latest announcements.
Acknowledgments
Special thanks to Daniel Langer from Datadog, as well as Bassu Hiremath and Parikshit Savjani for their contributions to this blog posting.