Azure Monitor, Azure Resource Manager, DevOps, Partners
Explore the latest features for Datadog—An Azure Native ISV Service
Posted on
4 min read
Datadog – An Azure Native ISV Service, that brings the power of Datadog’s observability capabilities to Azure, is generally available since 2021. The natively integrated service allows you to monitor and diagnose issues with your Azure resources by automatically sending logs and metrics to your Datadog organization.
The service is easy to provision and manage, like any other Azure resource, using the Azure Portal, Azure Command-Line Interface (CLI), software development kits (SDKs), and more. You do not need any custom code or connectors to start viewing your logs and metrics on the Datadog portal.
The service has continued to grow and has been adopted well by our joint customers. This service is developed and managed by Microsoft and Datadog and based on your feedback, we continue to invest in deeper integrations to make the experience smoother for you. Here are some of the top features shipped recently that we would like to highlight:
Monitor multiple subscriptions with a single Datadog Resource
We are excited to announce a scalable multi-subscription monitoring capability that allows you to configure monitoring for all your subscriptions through a single Datadog resource. This simplifies the process of monitoring numerous subscriptions as you do not need to setup a separate Datadog resource in every single subscription that you wish to monitor.
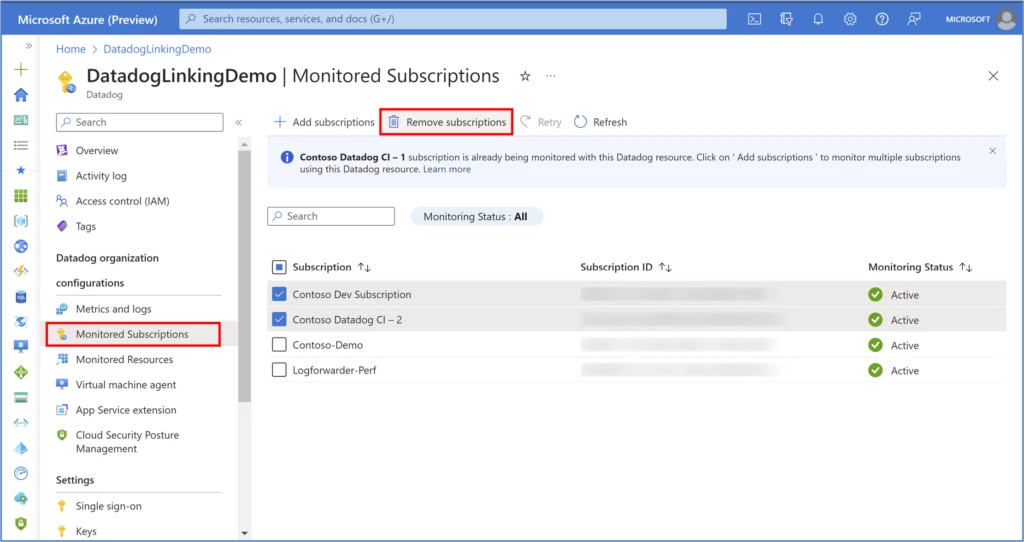
To start monitoring multiple subscriptions through a single “Datadog—An Azure Native ISV Service” resource, click on the Monitored Subscriptions blade under the Datadog organizations configurations section.
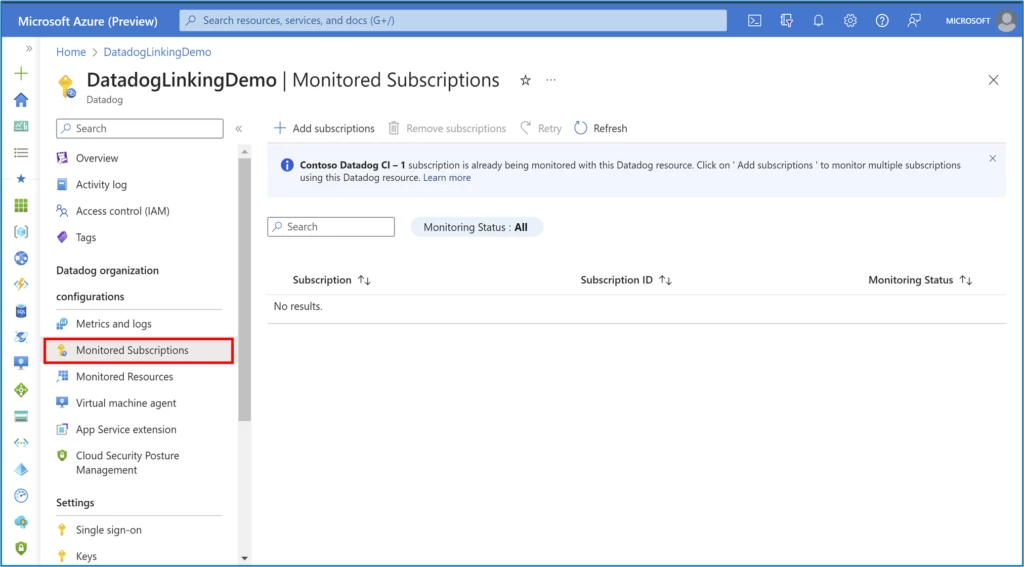
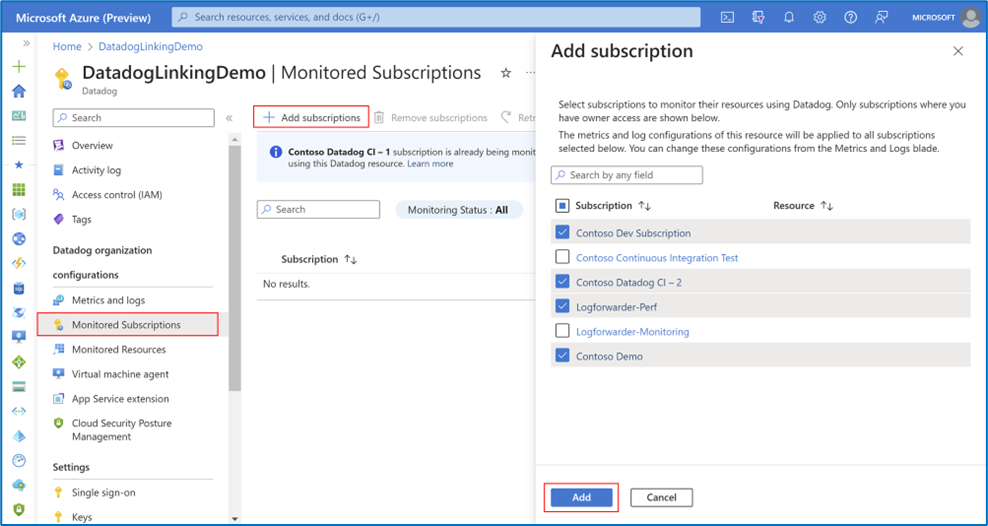
The subscription in which the Datadog resource is created is monitored by default. To include additional subscriptions, click on the “Add subscriptions” button and on the window that opens, select the subscriptions that you want to monitor using the same resource.
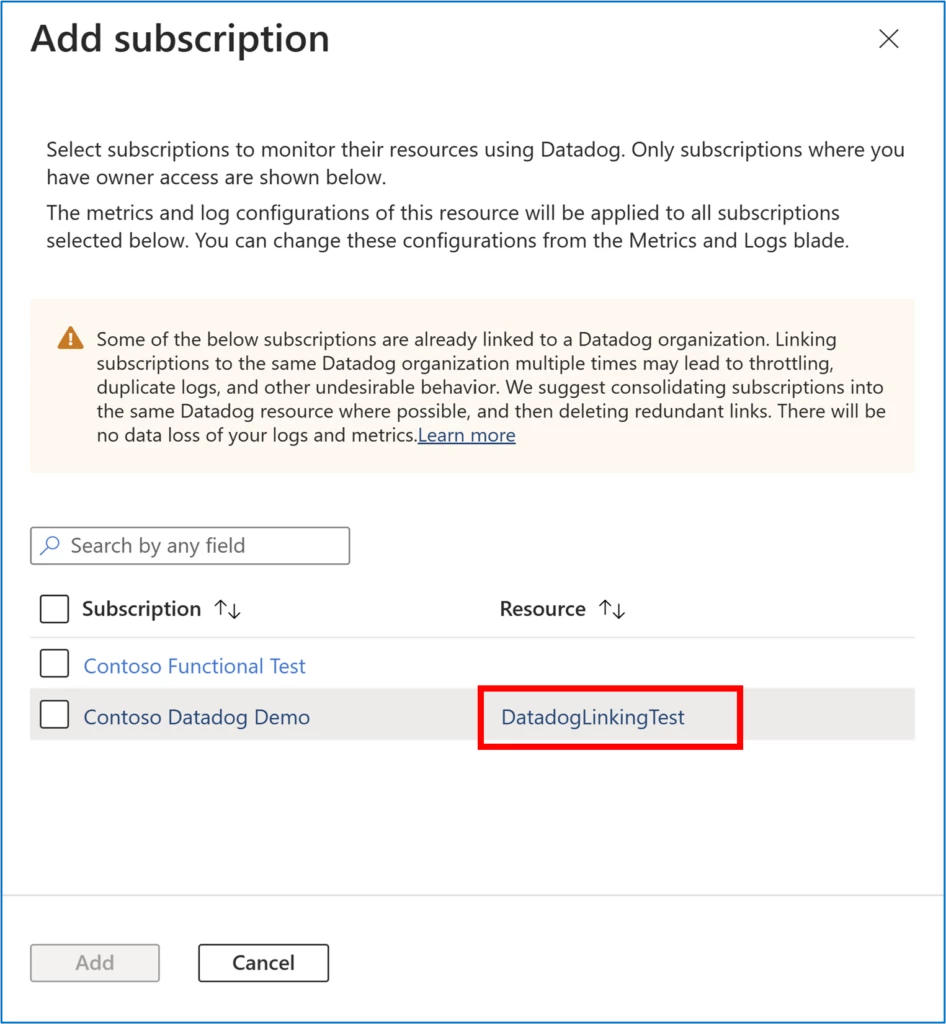
We recommend deleting redundant Datadog resources linked to the same organization and consolidating multiple subscriptions into a single Datadog resource wherever possible. This would help avoid duplicate data flow and issues like throttling. For example, in the image shown below, there is a resource named DatadogLinkingTest linked to the same organization in one of the subscriptions. You should ideally delete the resource before proceeding to add the subscription.
Click on Add to include the chosen subscriptions to the list of subscriptions being monitored through the Datadog resource.
The set of tag rules for metrics and logs defined for the Datadog resource apply to all subscriptions that are added for monitoring. If you wish to reconfigure the tag rules at any point, check Reconfigure rules for metrics and logs.
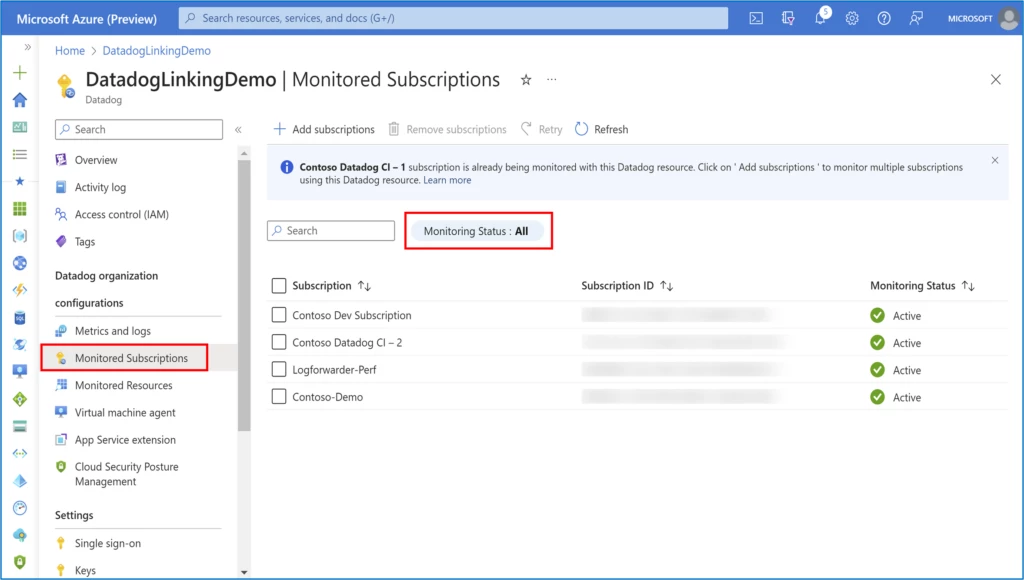
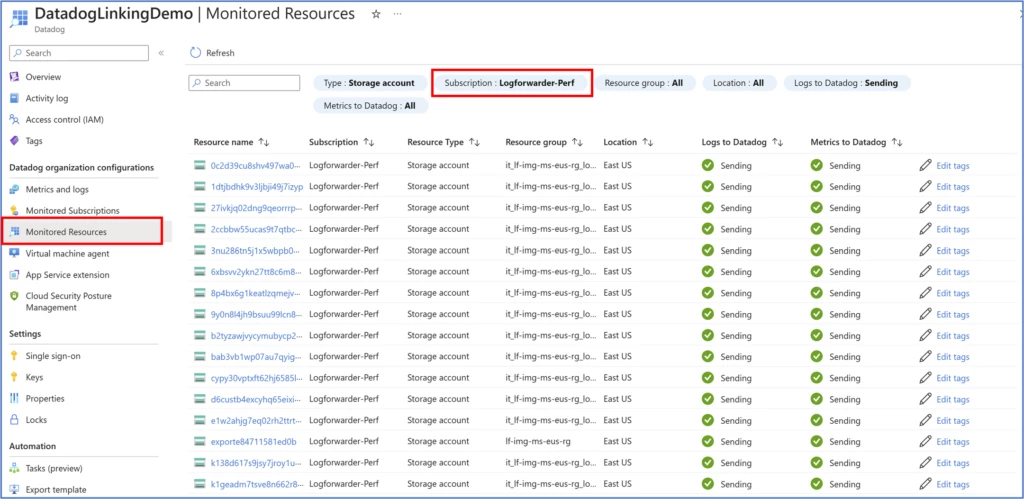
And now you are done. Go to the “Monitored Resources” blade in your Datadog resource and filter the subscription of your choice to check the status of logs and metrics being sent to Datadog for the resources in that subscription.
Likewise, agent management experience for App Services and virtual machines (VMs) also spans multiple subscriptions now.
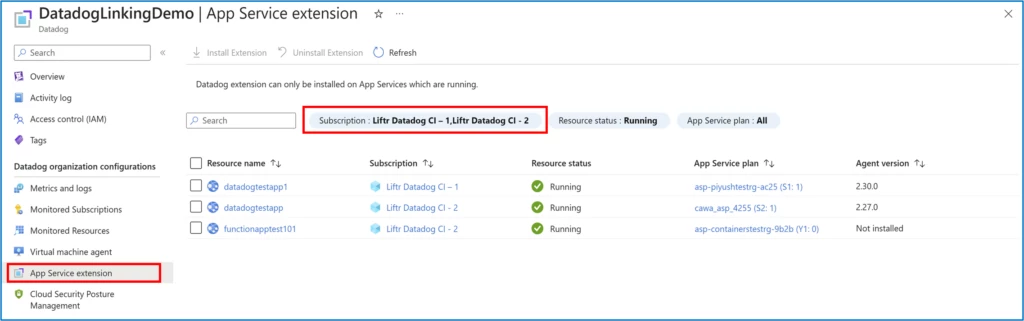
Check out Monitor virtual machines using the Datadog agent and Monitor App Services using the Datadog agent as an extension.
If at any point you wish to stop monitoring resources in a subscription via the Datadog resource, you can remove the subscription from the Monitored subscriptions list. In the Monitored Subscriptions blade, choose the subscription you no longer wish to monitor and click on “Remove subscriptions”. The default subscription (the one in which the Datadog resource is created) can’t be removed.
Log forwarder
The automatic log forwarding capability available out of the box with Datadog’s native integration on Azure eliminates time-consuming steps that require you to setup additional infrastructure and write custom code.
We are constantly working to support all resource categories on Azure Monitor to ship logs to Datadog. For customers who have setup monitoring tag rules in an Azure subscription, new resource types or categories get automatically enrolled for sending logs, without the need for customers to manually do any changes to enable new resource types. As of today, the native integration on Azure supports logs from 126 resource types to flow to Datadog.
Cloud Security Posture Management
In the Datadog Azure Native integration, enabling Cloud Security Posture Management (CSPM) for your Azure Resources is a straightforward operation in your Datadog resource. Navigate to the Cloud Security Posture Management blade, click on the checkbox to enable CSPM and click Save. The setting can be disabled at any point.
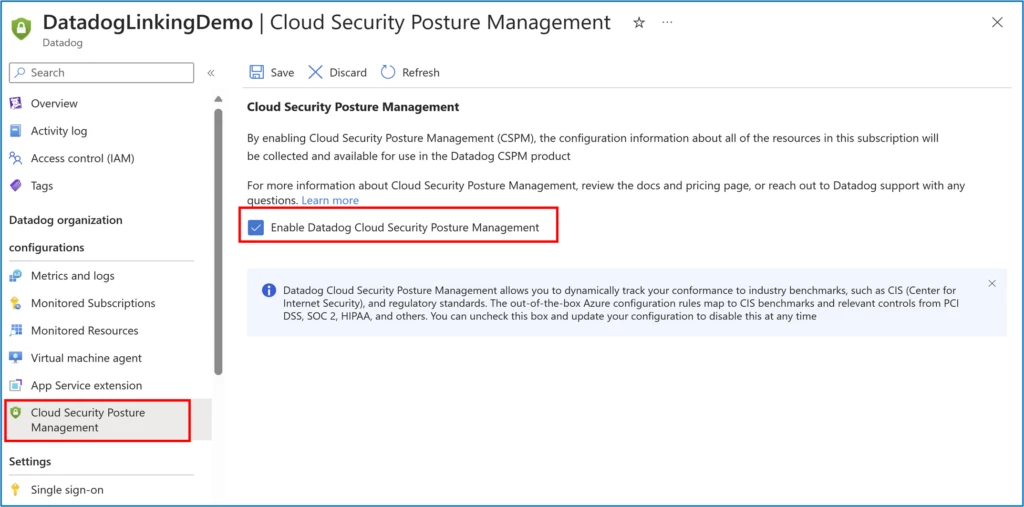
You can learn more about Datadog’s CSPM product here.
Mute monitor for expected virtual machine shutdowns
Imagine alerts being sent for expected VM shutdowns and waking you up in the middle of the night. Yikes! Now, with just the click of a checkbox, you can avoid scenarios where Datadog’s disaster prevention alert notifications get triggered during scheduled shutdowns. To mute the monitor for expected Azure Virtual Machine shutdowns, select the checkbox shown below in the Metrics and Logs blade.

Hope you are excited to try out all the cool features highlighted in this blog!
Next steps
- If you would like to subscribe to the service, check out Datadog – An Azure Native ISV Service from Azure marketplace.
- If you already use Datadog—an Azure Native ISV Service, and have feedback or feature requests, please share in our feedback forum.
- To learn more about the service, check out our documentation—Get started with Datadog – an Azure Native ISV Service.
- Share additional information about how you use resource and subscription logs to monitor and manage your cloud infrastructure and applications by responding to this survey.