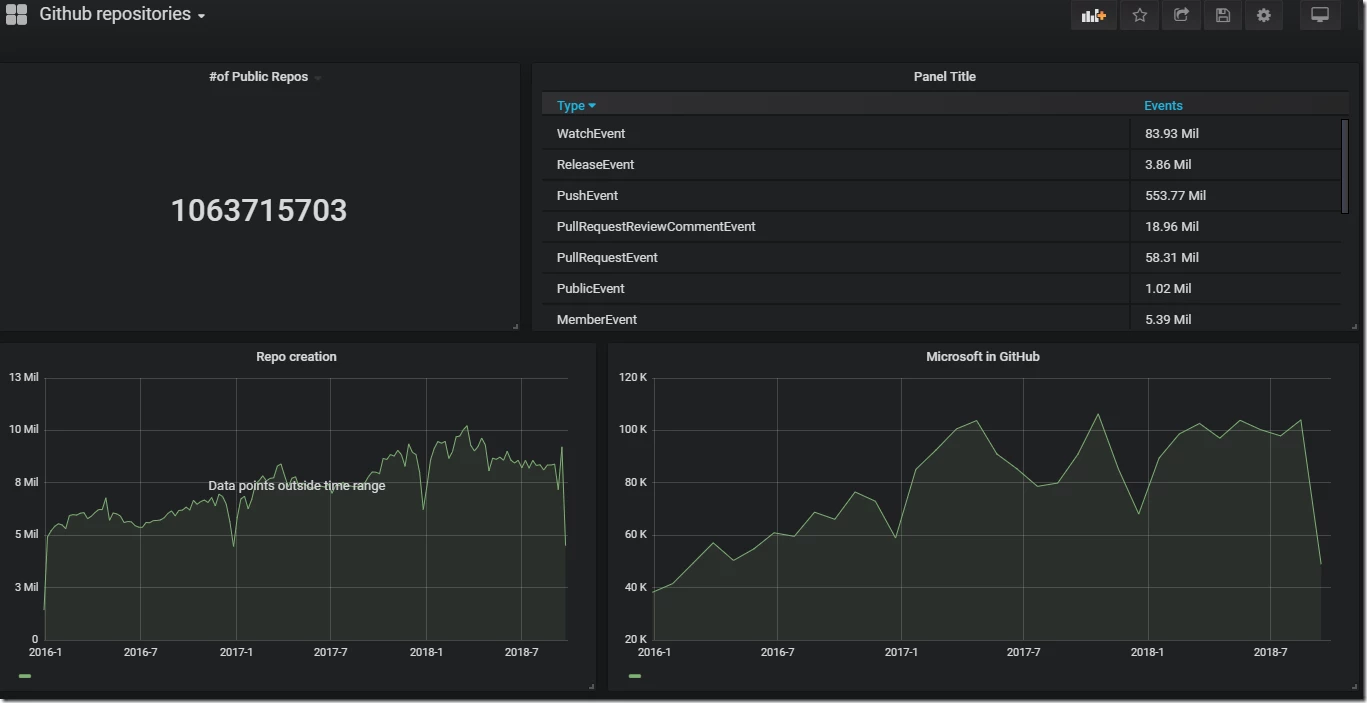
Are you using Azure Data Explorer to query vast amounts of data? Are you following business metrics and KPIs with Grafana dashboards? Creating a Grafana data source with Azure Data Explorer has never been easier.
Grafana is a leading open source software designed for visualizing time series analytics. It is an analytics and metrics platform that enables you to query and visualize data and create and share dashboards based on those visualizations. Combining Grafana’s beautiful visualizations with Azure Data Explorer’s snappy ad hoc queries over massive amounts of data, creates impressive usage potential.
The Grafana and Azure Data Explorer teams have created a dedicated plugin which enables you to connect to and visualize data from Azure Data Explorer using its intuitive and powerful Kusto Query Language. In just a few minutes, you can unlock the potential of your data and create your first Grafana dashboard with Azure Data Explorer.
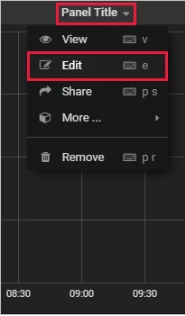
Once you build an Azure Data Explorer data source in Grafana, you can create a dashboard panel and select Edit to add your query.

Kusto Query Language is available for executing queries in the Metrics tab. The built-in intellisense which proposes query term completion, assists in query formulation. You run the query to visualize the data.
GithubEvent
| where Repo.name has 'Microsoft'
| summarize TotalEvents = count() by bin(CreatedAt,30d)
|order by CreatedAt asc


For more details on visualizing data from Azure Data Explorer in Grafana please visit our documentation, “Visualize data from Azure Data Explorer in Grafana.” It depicts the step-by-step process needed to set up Azure Data Explorer as a data source for Grafana, and then visualizes data from a sample cluster.
Next steps
In this blog, we depict the benefits of using Grafana for building dashboards on top of your Azure Data Explorer datasets. Additional connectors and plugins to analytics tools and services will be added in the weeks to come. Stay tuned for more updates.
To find out more about Azure Data Explorer you can:
- Try Azure Data Explorer in preview now.
- Find pricing information for Azure Data Explorer.
- Access documentation for Azure Data Explorer.