Azure Blob Storage, Azure Cosmos DB, Azure Front Door, Cloud Services, Hybrid + Multicloud, Management and Governance, Redis Cache, Thought leadership
Advancing Microsoft Teams on Azure—operating at pandemic scale
Posted on
11 min read
“The COVID-19 pandemic has reset what it means to work, study, and socialize. Like many of us, I have come to rely on Microsoft Teams as my connection to my colleagues. In this post, our friends from the Microsoft Teams product group—Rish Tandon (Corporate Vice President), Aarthi Natarajan (Group Engineering Manager), and Martin Taillefer (Architect)—share some of their learnings about managing and scaling an enterprise-grade, secure productivity app.” – Mark Russinovich, CTO, Azure
Scale, resiliency, and performance do not happen overnight—it takes sustained and deliberate investment, day over day, and a performance-first mindset to build products that delight our users. Since its launch, Teams has experienced strong growth: from launch in 2017 to 13 million daily users in July 2019, to 20 million in November 2019. In April, we shared that Teams has more than 75 million daily active users, 200 million daily meeting participants, and 4.1 billion daily meeting minutes. We thought we were accustomed to the ongoing work necessary to scale service at such a pace given the rapid growth Teams had experienced to date. COVID-19 challenged this assumption; would this experience give us the ability to keep the service running amidst a previously unthinkable growth period?
A solid foundation
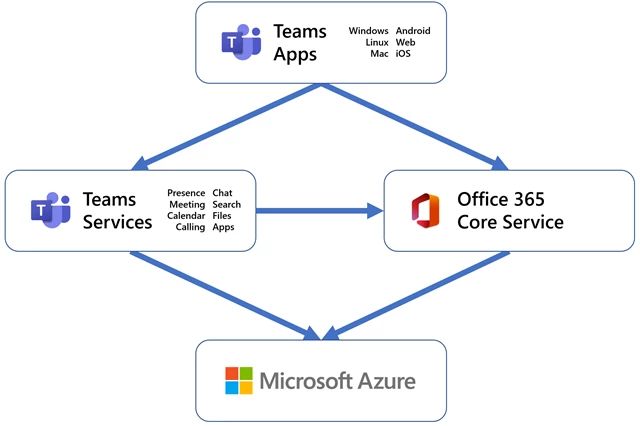
Teams is built on a microservices architecture, with a few hundred microservices working cohesively to deliver our product’s many features including messaging, meetings, files, calendar, and apps. Using microservices helps each of our component teams to work and release their changes independently.
Azure is the cloud platform that underpins all of Microsoft’s cloud services, including Microsoft Teams. Our workloads run in Azure virtual machines (VMs), with our older services being deployed through Azure Cloud Services and our newer ones on Azure Service Fabric. Our primary storage stack is Azure Cosmos DB, with some services using Azure Blob Storage. We count on Azure Cache for Redis for increased throughput and resiliency. We leverage Traffic Manager and Azure Front Door to route traffic where we want it to be. We use Queue Storage and Event Hubs to communicate, and we depend on Azure Active Directory to manage our tenants and users.
While this post is mostly focused on our cloud backend, it’s worth highlighting that the Teams client applications also use modern design patterns and frameworks, providing a rich user experience, and support for offline or intermittently connected experiences. The core ability to update our clients quickly and in tandem with the service is a key enabler for rapid iteration. If you’d like to go deeper into our architecture, check out this session from Microsoft Ignite 2019.
Agile development
Our CI/CD pipelines are built on top of Azure Pipelines. We use a ring-based deployment strategy with gates based on a combination of automated end-to-end tests and telemetry signals. Our telemetry signals integrate with incident management pipelines to provide alerting over both service- and client-defined metrics. We rely heavily on Azure Data Explorer for analytics.
In addition, we use an experimentation pipeline with scorecards that evaluate the behavior of features against key product metrics like crash rate, memory consumption, application responsiveness, performance, and user engagement. This helps us figure out whether new features are working the way we want them to.
All our services and clients use a centralized configuration management service. This service provides configuration state to flip product features on and off, adjust cache time-to-live values, control network request frequencies, and set network endpoints to contact for APIs. This provides a flexible framework to “launch darkly,” and to conduct A/B testing such that we can accurately measure the impact of our changes to ensure they are safe and efficient for all users.
Key resiliency strategies
We employ several resiliency strategies across our fleet of services:
- Active-active fault tolerant systems: An active-active fault tolerant system is defined as two (or more) operationally-independent heterogenous paths, with each path not only serving live traffic at a steady-state but also having the capability to serve 100 percent of expected traffic while leveraging client and protocol path-selection for seamless failover. We adopt this strategy for cases where there is a very large failure domain or customer impact with reasonable cost to justify building and maintaining heterogeneous systems. For example, we use the Office 365 DNS system for all externally visible client domains. In addition, static CDN-class data is hosted on both Azure Front Door and Akamai.
- Resiliency-optimized caches: We leverage caches between our components extensively, for both performance and resiliency. Caches help reduce average latency and provide a source of data in case a downstream service is unavailable. Keeping data in caches for a long time introduces data freshness issues yet keeping data in caches for a long time is the best defense against downstream failures. We focus on Time to Refresh (TTR) to our cache data as well as Time to Live (TTL). By setting a long TTL and a shorter TTR value, we can fine-tune how fresh to keep our data versus how long we want data to stick around whenever a downstream dependency fails.
- Circuit Breaker: This is a common design pattern that prevents a service from doing an operation that is likely to fail. It provides a chance for the downstream service to recover without being overwhelmed by retry requests. It also improves the response of a service when its dependencies are having trouble, helping the system be more tolerant of error conditions.
- Bulkhead isolation: We partition some of our critical services into completely isolated deployments. If something goes wrong in one deployment, bulkhead isolation is designed to help the other deployments to continue operating. This mitigation preserves functionality for as many customers as possible.
- API level rate limiting: We ensure our critical services can throttle requests at the API level. These rate limits are managed through the centralized configuration management system explained above. This capability enabled us to rate limit non-critical APIs during the COVID-19 surge.
- Efficient Retry patterns: We ensure and validate all API clients implement efficient retry logic, which prevents traffic storms when network failures occur.
- Timeouts: Consistent use of timeout semantics prevents work from getting stalled when a downstream dependency is experiencing some trouble.
- Graceful handling of network failures: We have made long-term investments to improve our client experience when offline or with poor connections. Major improvements in this area launched to production just as the COVID-19 surge began, enabling our client to provide a consistent experience regardless of network quality.
If you have seen the Azure Cloud Design Patterns, many of these concepts may be familiar to you. We also use the Polly library extensively in our microservices, which provides implementations for some of these patterns.
Our architecture had been working out well for us, Teams use was growing month-over-month and the platform easily scaled to meet the demand. However, scalability is not a “set and forget” consideration, it needs continuous attention to address emergent behaviors that manifest in any complex system.
When COVID-19 stay-at-home orders started to kick in around the world, we needed to leverage the architectural flexibility built into our system, and turn all the knobs we could, to effectively respond to the rapidly increasing demand.
Capacity forecasting
Like any product, we build and constantly iterate models to anticipate where growth will occur, both in terms of raw users and usage patterns. The models are based on historical data, cyclic patterns, new incoming large customers, and a variety of other signals.
As the surge began, it became clear that our previous forecasting models were quickly becoming obsolete, so we needed to build new ones that take the tremendous growth in global demand into account. We were seeing new usage patterns from existing users, new usage from existing but dormant users, and many new users onboarding to the product, all at the same time. Moreover, we had to make accelerated resourcing decisions to deal with potential compute and networking bottlenecks. We use multiple predictive modeling techniques (ARIMA, Additive, Multiplicative, Logarithmic). To that we added basic per-country caps to avoid over-forecasting. We tuned the models by trying to understand inflection and growth patterns by usage per industry and geographic area. We incorporated external data sources, including Johns Hopkins’ research for COVID-19 impact dates by country, to augment the peak load forecasting for bottleneck regions.
Throughout the process, we erred on the side of caution and favored over-provisioning—but as the usage patterns stabilized, we also scaled back as necessary.
Scaling our compute resources
In general, we design Teams to withstand natural disasters. Using multiple Azure regions helps us to mitigate risk, not just from a datacenter issue, but also from interruptions to a major geographic area. However, this means we provision additional resources to be ready to take on an impacted region’s load during such an eventuality. To scale out, we quickly expanded deployment of every critical microservice to additional regions in every major Azure geography. By increasing the total number of regions per geography, we decreased the total amount of spare capacity each region needed to hold to absorb emergency load, thereby reducing our total capacity needs. Dealing with load at this new scale gave us several insights into ways we could improve our efficiency:
- We found that by redeploying some of our microservices to favor a larger number of smaller compute clusters, we were able to avoid some per-cluster scaling considerations, helped speed up our deployments, and gave us more fine-grained load-balancing.
- Previously, we depended on specific virtual machine (VM) types we use for our different microservices. By being more flexible in terms of a VM type or CPU, and focusing on overall compute power or memory, we were able to make more efficient use of Azure resources in each region.
- We found opportunities for optimization in our service code itself. For example, some simple improvements led to a substantial reduction in the amount of CPU time we spend generating avatars (those little bubbles with initials in them, used when no user pictures are available).
Networking and routing optimization
Most of Teams’ capacity consumption occurs within daytime hours for any given Azure geography, leading to idle resources at night. We implemented routing strategies to leverage this idle capacity (while always respecting compliance and data residency requirements):
- Non-interactive background work is dynamically migrated to the currently idle capacity. This is done by programming API-specific routes in Azure Front Door to ensure traffic lands in the right place.
- Calling and meeting traffic was routed across multiple regions to handle the surge. We used Azure Traffic Manager to distribute load effectively, leveraging observed usage patterns. We also worked to create runbooks which did time-of-day load balancing to prevent wide area network (WAN) throttling.
Some of Teams’ client traffic terminates in Azure Front Door. However, as we deployed more clusters in more regions, we found new clusters were not getting enough traffic. This was an artifact of the distribution of the location of our users and the location of Azure Front Door nodes. To address this uneven distribution of traffic we used Azure Front Door’s ability to route traffic at a country level. In this example you can see below that we get improved traffic distribution after routing additional France traffic to the UK West region for one our services.
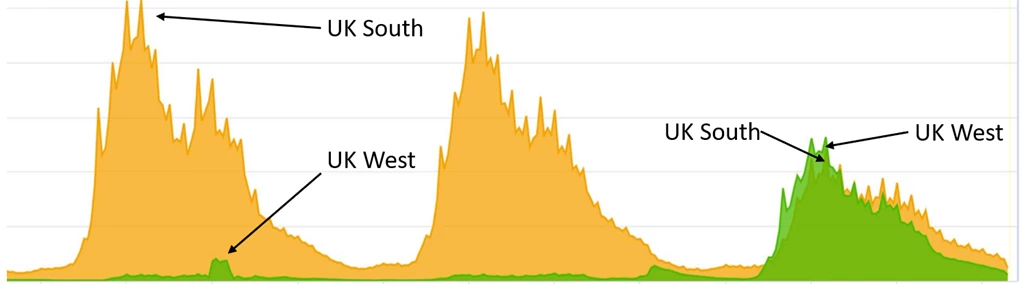
Figure 1: Improved traffic distribution after routing traffic between regions.
Cache and storage improvements
We use a lot of distributed caches. A lot of big, distributed caches. As our traffic increased, so did the load on our caches to a point where the individual caches would not scale. We deployed a few simple changes with significant impact on our cache use:
- We started to store cache state in a binary format rather than raw JSON. We used the protocol buffer format for this.
- We started to compress data before sending it to the cache. We used LZ4 compression due to its excellent speed versus compression ratio.
We were able to achieve a 65 percent reduction in payload size, 40 percent reduction in deserialization time, and 20 percent reduction in serialization time. A win all around.
Investigation revealed that several of our caches had overly aggressive TTL settings, resulting in unnecessary eager data eviction. Increasing those TTLs helped both reduce average latency and load on downstream systems.
Purposeful degradation (feature brownouts)
As we didn’t really know how far we’d need to push things, we decided it was prudent to put in place mechanisms that let us quickly react to unexpected demand spikes in order to buy us time to bring additional Teams capacity online.
Not all features have equal importance to our customers. For example, sending and receiving messages is more important than the ability to see that someone else is currently typing a message. Because of this, we turned off the typing indicator for a duration of two weeks while we worked on scaling up our services. This reduced peak traffic by 30 percent to some parts of our infrastructure.
We normally use aggressive prefetching at many layers of our architecture such that needed data is close at hand, which reduces average end-to-end latency. Prefetching however can get expensive, as it results in some amount of wasted work when fetching data that will never be used, and it requires storage resources to hold the prefetched data. In some scenarios we chose to disable prefetching, freeing up capacity on some of our services at the cost of higher latency. In other cases, we increased the duration of prefetch sync intervals. One such example was suppressing calendar prefetch on mobile which reduced request volume by 80 percent:
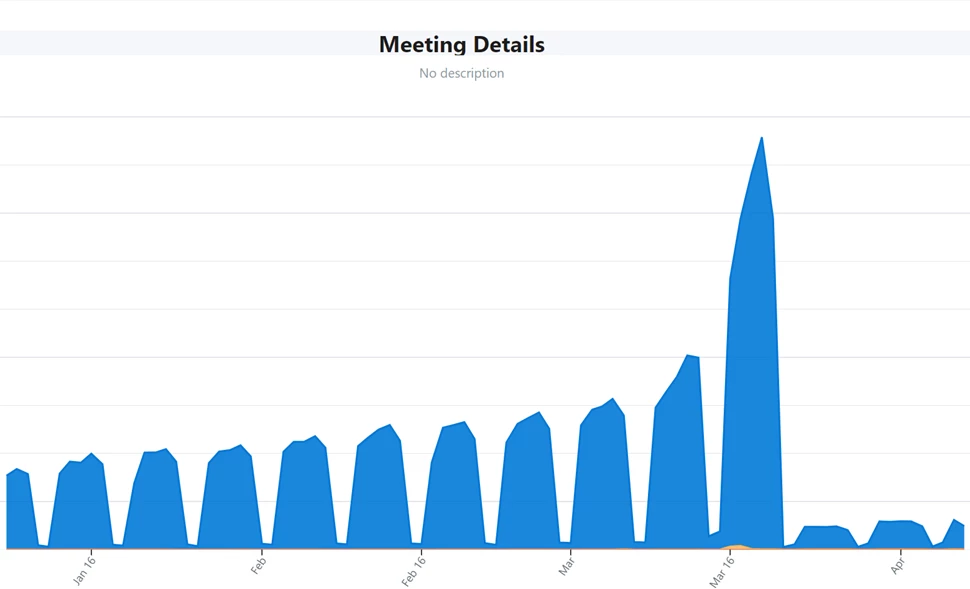
Figure 2: Disable prefetch of calendar event details in mobile.
Incident management
While we have a mature incident management process that we use to track and maintain the health of our system, this experience was different. Not only were we dealing with a huge surge in traffic, our engineers and colleagues were themselves going through personal and emotional challenges while adapting to working at home.
To ensure that we not only supported our customers but also our engineers, we put a few changes in place:
- Switched our incident management rotations from a weekly cadence to a daily cadence.
- Every on-call engineer had at least 12 hours off between shifts.
- We brought in more incident managers from across the company.
- We deferred all non-critical changes across our services.
These changes helped ensure that all of our incident managers and on-call engineers had enough time to focus on their needs at home while meeting the demands of our customers.
The future of Teams
It is fascinating to look back and wonder what this situation would have been like if it happened even a few years ago. It would have been impossible to scale like we did without cloud computing. What we can do today by simply changing configuration files could previously have required purchasing new equipment or even new buildings. As the current scaling situation stabilizes, we have been returning our attention to the future. We think there are many opportunities for us to improve our infrastructure:
- We plan to transition from VM-based deployments to container-based deployments using Azure Kubernetes Service, which we expect will reduce our operating costs, improve our agility, and align us with the industry.
- We expect to minimize the use of REST and favor more efficient binary protocols such as gRPC. We will be replacing several instances of polling throughout the system with more efficient event-based models.
- We are systematically embracing chaos engineering practices to ensure all those mechanisms we put in place to make our system reliable are always fully functional and ready to spring into action.
By keeping our architecture aligned with industry approaches and by leveraging best practices from the Azure team, when we needed to call for assistance, experts could quickly help us solve problems ranging from data analysis, monitoring, performance optimization and incident management. We are grateful for the openness of our colleagues across Microsoft and the broader software development community. While the architectures and technologies are important, it is the team of people you have that keeps your systems healthy.
Related post: Azure responds to COVID-19.
Related article: Growing Azure’s capacity to help customers, Microsoft during the COVID-19 pandemic.